Change font color to Bars


#1

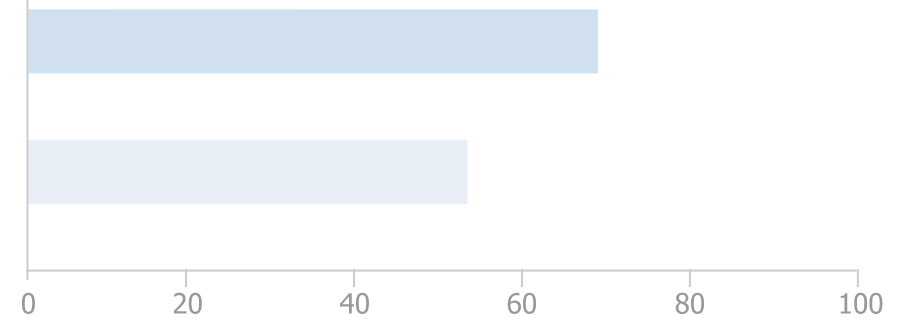
I know this may sound picky for someone. But we are migrating an existing app to a new UI design provided. So far we have accomplished most of the items but there are some that we don’t know how to do like for example change the axis font size and color of a bars visualization like this:

Does chartfactor provides any config for this? I’ve been looking in the doc but can’t find anything

#2

I saw that these visualizations are canvas based and they are built using echarts. Take a look here https://echarts.apache.org/en/option.html#title on how to do that.


#3

Yeah, but this is Echarts documentation which btw, had no Idea where to look for. In CF doc I can’t find anything about it.


#4

As @oliver mentioned, the standard package is mostly based on echarts. So you can access the echarts options for a given visualization like this:

const mychart = cf.getVisualization('div-element-id')
const options = mychart.get('__CHART__')

And in the options object you will have the full echarts configuration for that instance. You can modify the configurations and set it back in a similar fashion:

myChart.set('__CHART__', options)

The documentation for every parameter and configuration for Echarts is the same link provided by @oliver.


#5

Thanks @eduardo, that helps. The problem is that is done once the visualization is created and rendered. Is there any way to do that from the beginning? The other thing is that I haven’t found the right configuration, echarts has soooo many, but at least I have something to test.


#6

If you use the execute:stop event as discussed here to modify the visual in an early stage it may work.


#7

@lennydev, Any luck on how to configure the fonts colors? I’m working on a Scatter Plot but I guess it will be the same.


#8

Yes, Echarts documentation is extensive but once you learn how to use it becomes easier. I haven’t tried with other visualization besides the Bars, but I guess it will be the same. Here is the how I did it (combined with @eduardo and @william solutions):

    .on('execute:stop', () => {
            const options = mychart.get('__CHART__');

            opts.yAxis[0].axisLine.lineStyle.color = color;
            opts.yAxis[0].axisTick.lineStyle.color = color;
            opts.xAxis[0].axisLine.lineStyle.color = color;
            opts.xAxis[0].axisTick.lineStyle.color = color;
            opts.xAxis[0].axisLabel.fontSize = 11;
            opts.yAxis[0].axisLabel.fontSize = 11;
            opts.yAxis[0].axisLabel.margin = 11;

            myChart.set('__CHART__', options)
})