Hi guys, I have three visualizations, a Trend, a Scatter Plot and a Bars. They are all grouped by the same field although they use different metrics. As you can see, I have the legends enabled in each of them, but it turns out that the legends are the same since, as I said before, I am using the same field.
Is there any way to create a common legend for the three visualizations, in such a way that I can save space for the charts and also not repeat the information?
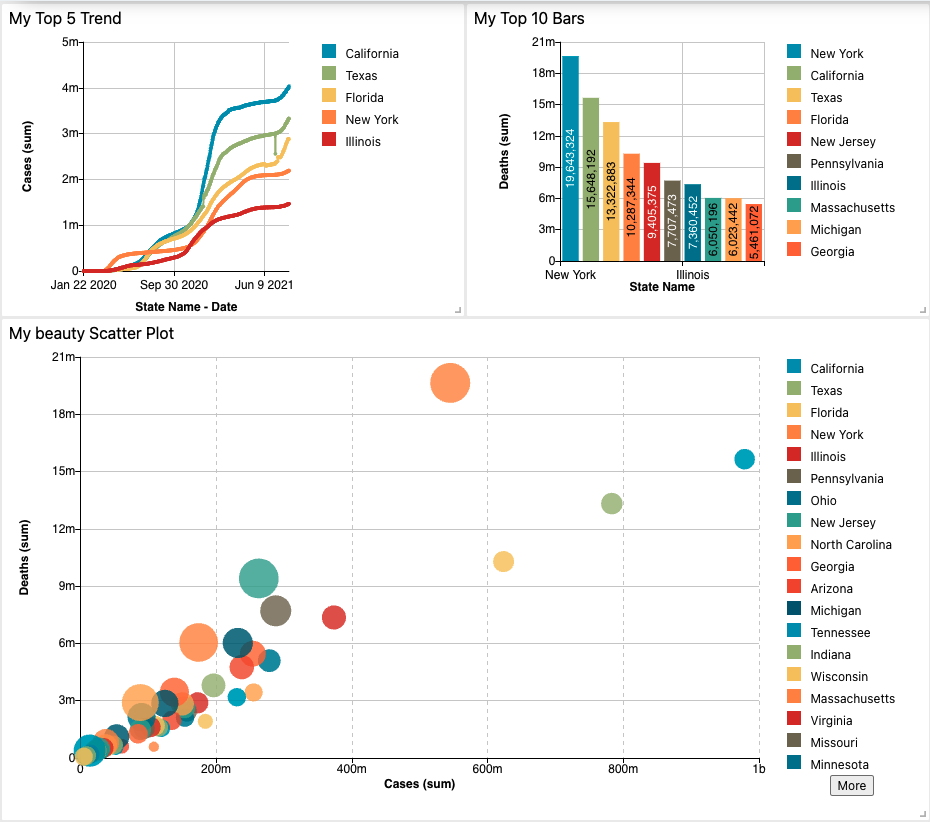
My graphs look similar to the following:
Hi @moshdev, for this case, there is a very elegant solution that ChartFactor provides, which is the use of the Group Legend visualization, which fits perfectly since all charts share a common group.
Take a look and tell me if it meets what you’re looking for.
Hi @juan.dominguez, I think you have nailed what I was looking for. I have reviewed the documentation for Group Legend and in my opinion it is very cool and flexible. I added it and it works.
One more question, when I click on a legend item, a filter is added but the rest of the legend items disappear. What is the proper setting to continue displaying unselected legend items?
To achieve that, all you have to do is add a rule in the InteractionManager so that the Legend uses the client filters.
It would be something like this:
let rules = {
    ['myLegendId']: { clientFilters: true },
};

// And then apply this to the IM
.set("rules", rules)
Just let me know if you need anything else…