Hi community, I don’t know if this is possible but I want to create a widget that shows a verbose explanation of what the user is viewing in each time depending on the applied filters, for example, “Crimes in the New York City from 2007 to 2009”. I can do this with the Markup widget or I have other options. Thanks.
Hi @eric, the Markup Widget does not have any way to set up logic on it. You can use a Custom Chart to archive your goal. Please take a look on the Custom Chart documentation page, and let me know if you have any doubt. Best Regards.
Hi @dario, thanks for the suggestion. Is there a template or skeleton I can use to create my custom chart? Thanks.
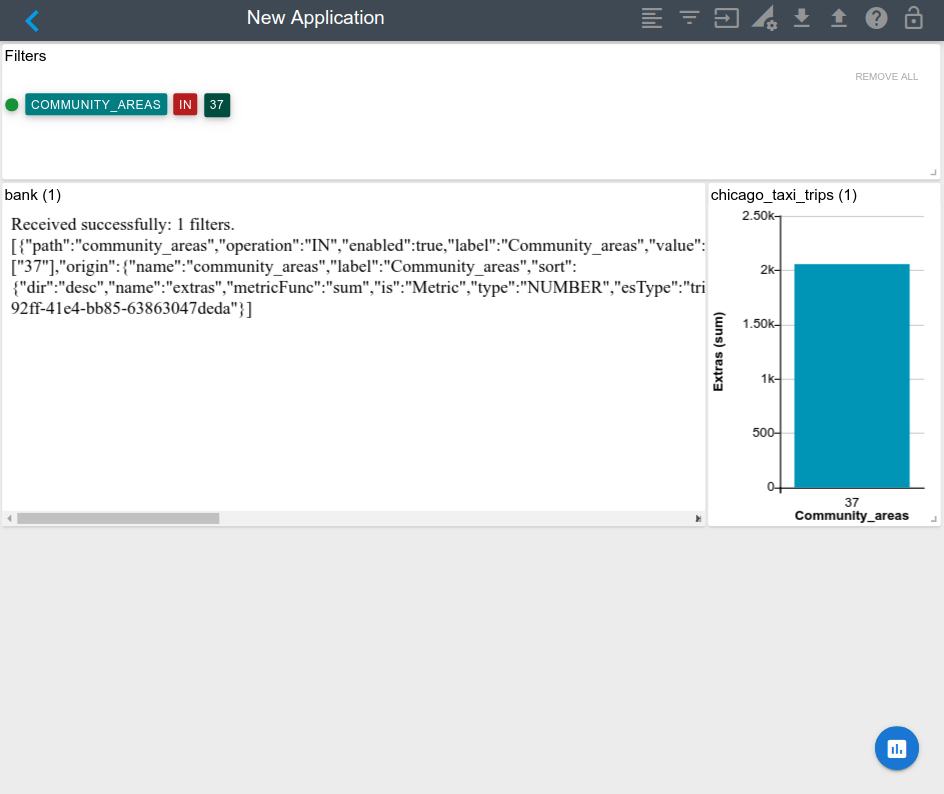
Here is an example of how to create a Custom Chart that only receives filters and shows it on her body. You can extend it with your logic and styles.
<!DOCTYPE html>
<html>
    <head>
        <meta charset="UTF-8">
        <title>My Custom Chart</title>
        <script>
            function isValidJSONString(str) {
                try {
                    JSON.parse(str);
                } catch (e) {
                    return false;
                }
                return true;
            };

            function receiveMessage(event) {
                if (event.data && isValidJSONString(event.data)) {
                    let data = JSON.parse(event.data);

                    if (data.config && data.config.filters) {
                        if (data.config.filters.length > 0) {
                            document.body.innerHTML = `Received successfully: ${data.config.filters.length} filters. <br /> ${JSON.stringify(data.config.filters)}`;
                        } else {
                            document.body.innerHTML = 'Removed successfully all filters.';
                        }
                    }
                }
            }
            window.addEventListener('message', receiveMessage, false);
        </script>
    </head>

    <body>
        <span>Please add a filter to the data app.</span>
    </body>
</html>
You have to copy that code in a file called index.html and copy it to a development http server, that could be a simple python http server. You can run a python server with the following command python server python3 -m http.server 8080. After that in ChartFactor Studio you have to create a Custom Chart with the following code:
let aktive = cf.create();
let myChart = aktive.graph("Custom Chart")
            .set("url", "http://127.0.0.1:8080/")
        .execute();
Remember that you have to select “Load unsafe script” on the browser to allow the inclusion of insecure resources (your custom chart: http) into a secure site (public studio: https) more info here.
I hope this can help you, let me know if you have more questions. Best regards.
hi @dario, your example is a great code base to start working on. Only a couple of more questions, if I want to use a UI Framework on my Custom Chart I have to be aware to do not override some CSS rules of the Studio? I will have styles rules of Studio enabled on my Custom Chart? I will have to be aware of some library overwriting? Thanks in advance.
Custom Charts are completely isolated from the studio and vice versa, so you don’t have to worry on style or library override. Let me know if you have more questions. Best regards.
Thanks for the response. I have made good progress on my Custom Chart. One last question, I need the min and max values for some metrics of my data source, can I request that information to Studio? If not possible, how can I do this easily?
From now the bidirectional communication of the Custom Charts is limited to the filters. In the future, we plan to extend the communication possibilities, but for now, what you can do is include the toolkit on your custom application and run the queries in the Custom Chart itself, you can see the Querying Data section of the documentation. Please let me know if you have any doubt. Best regards.