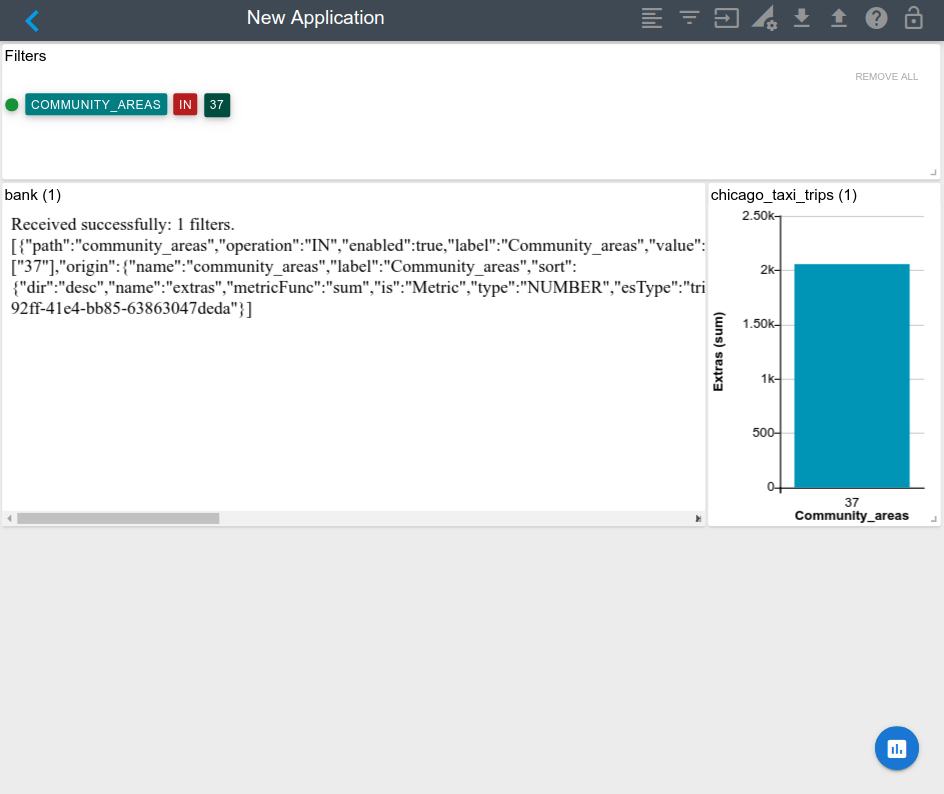
Here is an example of how to create a Custom Chart that only receives filters and shows it on her body. You can extend it with your logic and styles.
<!DOCTYPE html>
<html>
    <head>
        <meta charset="UTF-8">
        <title>My Custom Chart</title>
        <script>
            function isValidJSONString(str) {
                try {
                    JSON.parse(str);
                } catch (e) {
                    return false;
                }
                return true;
            };

            function receiveMessage(event) {
                if (event.data && isValidJSONString(event.data)) {
                    let data = JSON.parse(event.data);

                    if (data.config && data.config.filters) {
                        if (data.config.filters.length > 0) {
                            document.body.innerHTML = `Received successfully: ${data.config.filters.length} filters. <br /> ${JSON.stringify(data.config.filters)}`;
                        } else {
                            document.body.innerHTML = 'Removed successfully all filters.';
                        }
                    }
                }
            }
            window.addEventListener('message', receiveMessage, false);
        </script>
    </head>

    <body>
        <span>Please add a filter to the data app.</span>
    </body>
</html>
You have to copy that code in a file called index.html and copy it to a development http server, that could be a simple python http server. You can run a python server with the following command python server python3 -m http.server 8080. After that in ChartFactor Studio you have to create a Custom Chart with the following code:
let aktive = cf.create();
let myChart = aktive.graph("Custom Chart")
            .set("url", "http://127.0.0.1:8080/")
        .execute();
Remember that you have to select “Load unsafe script” on the browser to allow the inclusion of insecure resources (your custom chart: http) into a secure site (public studio: https) more info here.
I hope this can help you, let me know if you have more questions. Best regards.