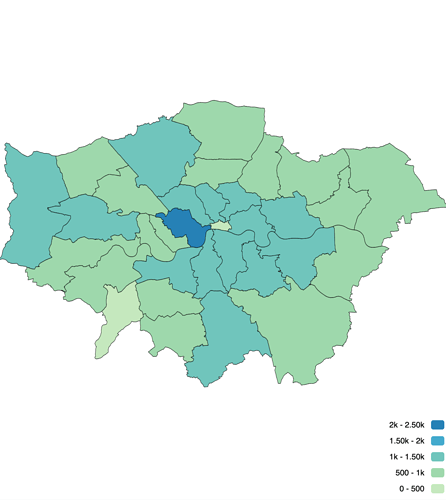
Hi, I am using the vector map and I am coloring it by a metric. It works but it would be great if I could have colors for different value ranges. Is that available?
Yes, you can do that easily using ChartFactor 1.11. The code below defines color ranges for a vector map. Screen shot also attached.
/* Configuration code for this widget */
let provider = cf.provider("Aktiun Elastic");
let source = provider.source('london_fire_brigade');
// Define metrics
let metric0 = cf.Metric();
// Define attributes to group by
let group1 = cf.Attribute("proper_case")
            .limit(100)
            .sort("desc", cf.Metric());

// Add metrics and groups to data source
let myData = source.groupby(group1)
            .metrics(metric0);
// Color
var color = cf.Color()
var palette = ['#ccebc5','#a8ddb5','#7bccc4','#4eb3d3','#2b8cbe'].reverse();
color.palette(palette);
color.metric(metric0);
color.range([
    {min: 0, max: 500, color: '#ccebc5'},
    {min: 500, max: 1000, color: '#a8ddb5'},
    {min: 1000, max: 1500, color: '#7bccc4'},
    {min: 1500, max: 2000, color: '#4eb3d3'},
    {min: 2000, max: 2500, color: '#2b8cbe'},

]);
// Define chart options
let myChart = myData.graph("Vector Map")
            .set("map", londonShape)
            .set('color', color)
            .set('enableZoom', false)
            .set('zoom', 1.0)
            .set("legend", "right")
            .execute();
