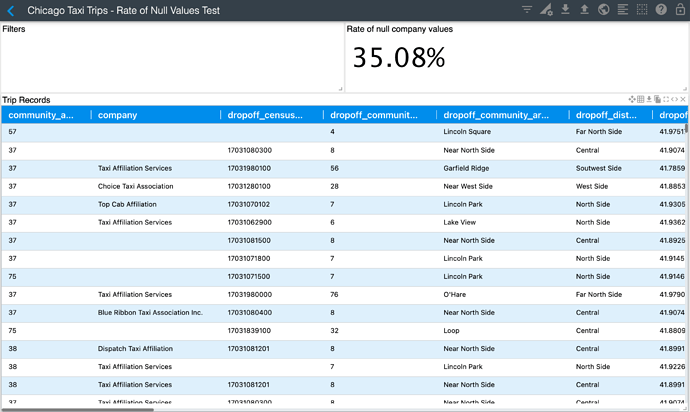
Hi @dmitry, please check the attached CFS file where I have a KPI widget showing the rate of null values found in the company field for the Chicago Taxi Trips dataset. You can load this file in your Studio and play with it.
I am also pasting the KPI widget code below.
/* Configuration code for this widget */
let provider = cf.provider("Elastic Demo");
let source = provider.source('chicago_taxi_trips');
// Define metrics
let metric0 = cf.Metric();
// Filter that trigger the comparative
const filter = cf.Filter('company').in(null);
const rate = cf.CompareMetric()
                    .rate()
                    .using('company')
                    .label('Rate');
// Add metrics and groups to data source
let myData = source
.metrics(rate);
myData.staticFilters(filter);
// --- Define chart options and static filters ---
let myChart = myData.graph("KPI")
.set("mainTextSize", 12)
.set("secondaryTextSize", 12)
.set("diffTextSize", 12)
.set("labelTextSize", 8)
.set("showLabels", false)
.execute();
After the execution of the above code, the KPI visualization looks like this::
Copy and paste this code into a .cfs file and load in CharFactor Studio:
{
    "id": "f8b84a9e-8abc-483e-b020-85048c2bd595",
    "name": "Chicago Taxi Trips - Rate of Null Values Test",
    "description": "Application developed using CF Studio",
    "state": "home",
    "readOnly": false,
    "hasBorder": true,
    "widgetList": [
        {
            "id": "visa93ce385-de82-40e7-815f-a0f79dd423b8",
            "isIManager": true,
            "layout": {
                "w": 6,
                "h": 2,
                "x": 0,
                "y": 0,
                "i": "visa93ce385-de82-40e7-815f-a0f79dd423b8",
                "moved": false,
                "static": false
            },
            "title": "Filters",
            "visualization": "Interaction Manager",
            "source": {},
            "code": [
                "/* Configuration code for the Interaction Manager*/",
                "",
                "",
                "// Drill hierarchy and rule settings can be done like this:",
                "// let viz1 = getId(\"widget_title_1\")",
                "// let viz2 = getId(\"widget_title_2\")",
                "// let drill = { [viz1]: { group1: []}}",
                "// let rules = { [viz2]: { receive: false }}",
                "",
                "// NOTE: Drill hierarchy will change your code!",
                "// Define options",
                "let aktive = cf.create();",
                "let myChart = aktive.graph(\"Interaction Manager\")",
                "\t//.set(\"rules\", rules)",
                "\t//.set(\"drill\", drill)",
                "\t.execute();",
                ""
            ],
            "showUI": false
        },
        {
            "id": "visc8ecaea6-a98b-4e33-9885-512190f59d9d",
            "layout": {
                "w": 12,
                "h": 11,
                "x": 0,
                "y": 2,
                "i": "visc8ecaea6-a98b-4e33-9885-512190f59d9d1",
                "moved": false,
                "static": false
            },
            "title": "Trip Records",
            "visualization": "Raw Data Table",
            "source": {
                "name": "chicago_taxi_trips",
                "provider": {
                    "name": "Elastic Demo",
                    "type": "elasticsearch"
                }
            },
            "code": [
                "/* Configuration code for this widget */",
                "let provider = cf.provider(\"Elastic Demo\");",
                "let source = provider.source('chicago_taxi_trips');",
                "// Declare your fields (do not remove this comment line)",
                "const fields = [",
                "    cf.Field('community_areas', 'community_areas'),",
                "    cf.Field('company', 'company'),",
                "    cf.Field('dropoff_census_tract', 'dropoff_census_tract'),",
                "    cf.Field('dropoff_community_area', 'dropoff_community_area'),",
                "    cf.Field('dropoff_community_area_desc', 'dropoff_community_area_desc'),",
                "    cf.Field('dropoff_district', 'dropoff_district'),",
                "    cf.Field('dropoff_latitude', 'dropoff_latitude'),",
                "    cf.Field('dropoff_longitude', 'dropoff_longitude'),",
                "    cf.Field('extras', 'extras'),",
                "    cf.Field('fare', 'fare'),",
                "    cf.Field('payment_type', 'payment_type'),",
                "    cf.Field('pickup_census_tract', 'pickup_census_tract'),",
                "    cf.Field('pickup_community_area', 'pickup_community_area'),",
                "    cf.Field('pickup_community_area_desc', 'pickup_community_area_desc'),",
                "    cf.Field('pickup_district', 'pickup_district'),",
                "    cf.Field('pickup_latitude', 'pickup_latitude'),",
                "    cf.Field('pickup_longitude', 'pickup_longitude'),",
                "    cf.Field('taxi_id', 'taxi_id'),",
                "    cf.Field('tips', 'tips'),",
                "    cf.Field('tolls', 'tolls'),",
                "    cf.Field('trip_end_day_of_week', 'trip_end_day_of_week'),",
                "    cf.Field('trip_end_hour', 'trip_end_hour'),",
                "    cf.Field('trip_end_timestamp', 'trip_end_timestamp'),",
                "    cf.Field('trip_id', 'trip_id'),",
                "    cf.Field('trip_miles', 'trip_miles'),",
                "    cf.Field('trip_minutes', 'trip_minutes'),",
                "    cf.Field('trip_seconds', 'trip_seconds'),",
                "    cf.Field('trip_start_date_string', 'trip_start_date_string'),",
                "    cf.Field('trip_start_day_of_week', 'trip_start_day_of_week'),",
                "    cf.Field('trip_start_hour', 'trip_start_hour'),",
                "    cf.Field('trip_start_timestamp', 'trip_start_timestamp'),",
                "    cf.Field('trip_start_timestamp_epoch', 'trip_start_timestamp_epoch'),",
                "    cf.Field('trip_total', 'trip_total'),",
                "];",
                "let myData = source.fields(fields);",
                "let color = cf.Color();",
                "color.theme({",
                "    \"headerStyle\":\"background: #2196f3; color: #fff; font-size: 16px;\",",
                "    \"headerIconStyle\":\"color: #fff; font-size: 16px;\",",
                "    \"rowOddStyle\":\"background: #fff; color: #000;\",",
                "    \"rowEvenStyle\":\"background: #e3f2fd; color: #000;\",",
                "    \"headerResizeLineStyle\":\"border-right-color: #fff; border-right-width: 1px;\",",
                "    \"headerHorizontalLineStyle\":\"border-bottom-color: #fff; border-bottom-width: 1px;\",",
                "    \"tpButtonActive\":\"color: #fff; background: #2196f3;\",",
                "    \"cellMoving\":\"color: black; background: #90caf9;\",",
                "});",
                "// --- Define chart options and static filters ---",
                "let myChart = myData.graph(\"Raw Data Table\")",
                "    .set('color',color)",
                "    .set(\"columnFilters\", [",
                "        { field: \"community_areas\", component: \"slicer\"},",
                "        { field: \"company\", component: \"slicer\"},",
                "        { field: \"dropoff_census_tract\", component: \"slicer\"},",
                "        { field: \"dropoff_community_area\", component: \"slicer\"},",
                "        { field: \"dropoff_community_area_desc\", component: \"slicer\"},",
                "        { field: \"dropoff_district\", component: \"slicer\"},",
                "        { field: \"dropoff_latitude\", component: \"slicer\"},",
                "        { field: \"dropoff_longitude\", component: \"slicer\"},",
                "        { field: \"extras\", component: \"range\"},",
                "        { field: \"fare\", component: \"range\"},",
                "        { field: \"payment_type\", component: \"slicer\"},",
                "        { field: \"pickup_census_tract\", component: \"slicer\"},",
                "        { field: \"pickup_community_area\", component: \"slicer\"},",
                "        { field: \"pickup_community_area_desc\", component: \"slicer\"},",
                "        { field: \"pickup_district\", component: \"slicer\"},",
                "        { field: \"pickup_latitude\", component: \"slicer\"},",
                "        { field: \"pickup_longitude\", component: \"slicer\"},",
                "        { field: \"taxi_id\", component: \"slicer\"},",
                "        { field: \"tips\", component: \"range\"},",
                "        { field: \"tolls\", component: \"range\"},",
                "        { field: \"trip_end_day_of_week\", component: \"slicer\"},",
                "        { field: \"trip_end_hour\", component: \"slicer\"},",
                "        { field: \"trip_end_timestamp\", component: \"datePicker\", props: {func: 'DAY'}},",
                "        { field: \"trip_id\", component: \"slicer\"},",
                "        { field: \"trip_miles\", component: \"slicer\"},",
                "        { field: \"trip_minutes\", component: \"range\"},",
                "        { field: \"trip_seconds\", component: \"slicer\"},",
                "        { field: \"trip_start_date_string\", component: \"slicer\"},",
                "        { field: \"trip_start_day_of_week\", component: \"slicer\"},",
                "        { field: \"trip_start_hour\", component: \"slicer\"},",
                "        { field: \"trip_start_timestamp\", component: \"datePicker\", props: {func: 'DAY'}},",
                "        { field: \"trip_start_timestamp_epoch\", component: \"slicer\"},",
                "        { field: \"trip_total\", component: \"range\"},",
                "    ])",
                "    .set(\"autoSizeColumns\", true)",
                "    .limit(100)",
                "    .execute();"
            ],
            "showUI": true
        },
        {
            "id": "vis8df07bc3-edbb-4a9d-85b8-184fe843a21f",
            "layout": {
                "w": 3,
                "h": 2,
                "x": 6,
                "y": 0,
                "i": "vis8df07bc3-edbb-4a9d-85b8-184fe843a21f1",
                "moved": false,
                "static": false
            },
            "title": "Rate of null company values",
            "visualization": "KPI",
            "source": {
                "name": "chicago_taxi_trips",
                "provider": {
                    "name": "Elastic Demo",
                    "type": "elasticsearch"
                }
            },
            "code": [
                "/* Configuration code for this widget */",
                "let provider = cf.provider(\"Elastic Demo\");",
                "let source = provider.source('chicago_taxi_trips');",
                "// Define metrics",
                "let metric0 = cf.Metric();",
                "// Filter that trigger the comparative",
                "const filter = cf.Filter('company').in(null);",
                "const rate = cf.CompareMetric()",
                "                    .rate()",
                "                    .using('company')",
                "                    .label('Rate');",
                "// Add metrics and groups to data source",
                "let myData = source",
                "\t\t\t.metrics(rate);",
                "myData.staticFilters(filter);",
                "// --- Define chart options and static filters ---",
                "let myChart = myData.graph(\"KPI\")",
                "\t\t\t.set(\"mainTextSize\", 12)",
                "\t\t\t.set(\"secondaryTextSize\", 12)",
                "\t\t\t.set(\"diffTextSize\", 12)",
                "\t\t\t.set(\"labelTextSize\", 8)",
                "\t\t\t.set(\"showLabels\", false)",
                "\t\t\t.execute();",
                ""
            ],
            "showUI": false
        }
    ],
    "filters": [],
    "savedFilters": [],
    "folderPath": "/",
    "deletedWidgets": [],
    "metadata": {},
    "customQueries": {}
}||||[
    {
        "name": "Elastic Demo",
        "url": "https://chartfactor.com/elastic",
        "active": true,
        "provider": "elasticsearch",
        "id": "560b7390-25a5-493e-8bea-dd244b534cc8"
    }
]
Hope this can help you.

