Hi all, I’m new in the community, and right now I am building a dashboard with some visualizations. There is a specific one that I want to be able to build, and it is something like a Card View. I know that ChartFactor has two visualizations which are Raw Data Table and Pivot Table, to display the data in rows as it comes from the data source.
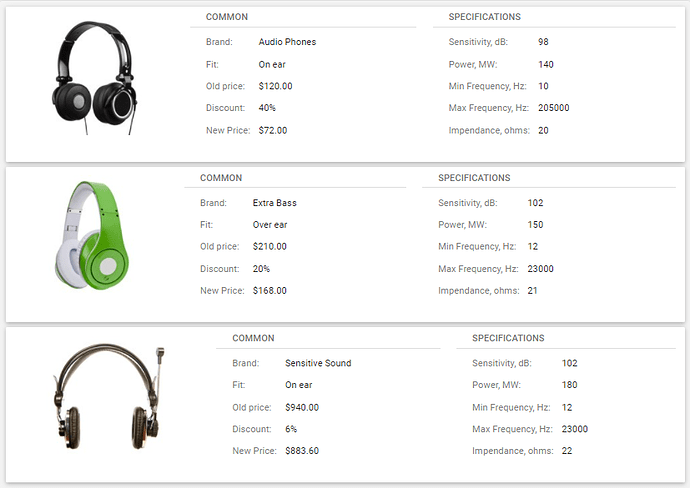
In this case what I want to do is show the data in rows but with a card format, something like this:
My questions are, is there a recommended way to achieve this? What component or visualization should I use to have this interface and of course is it affected by filtering?
