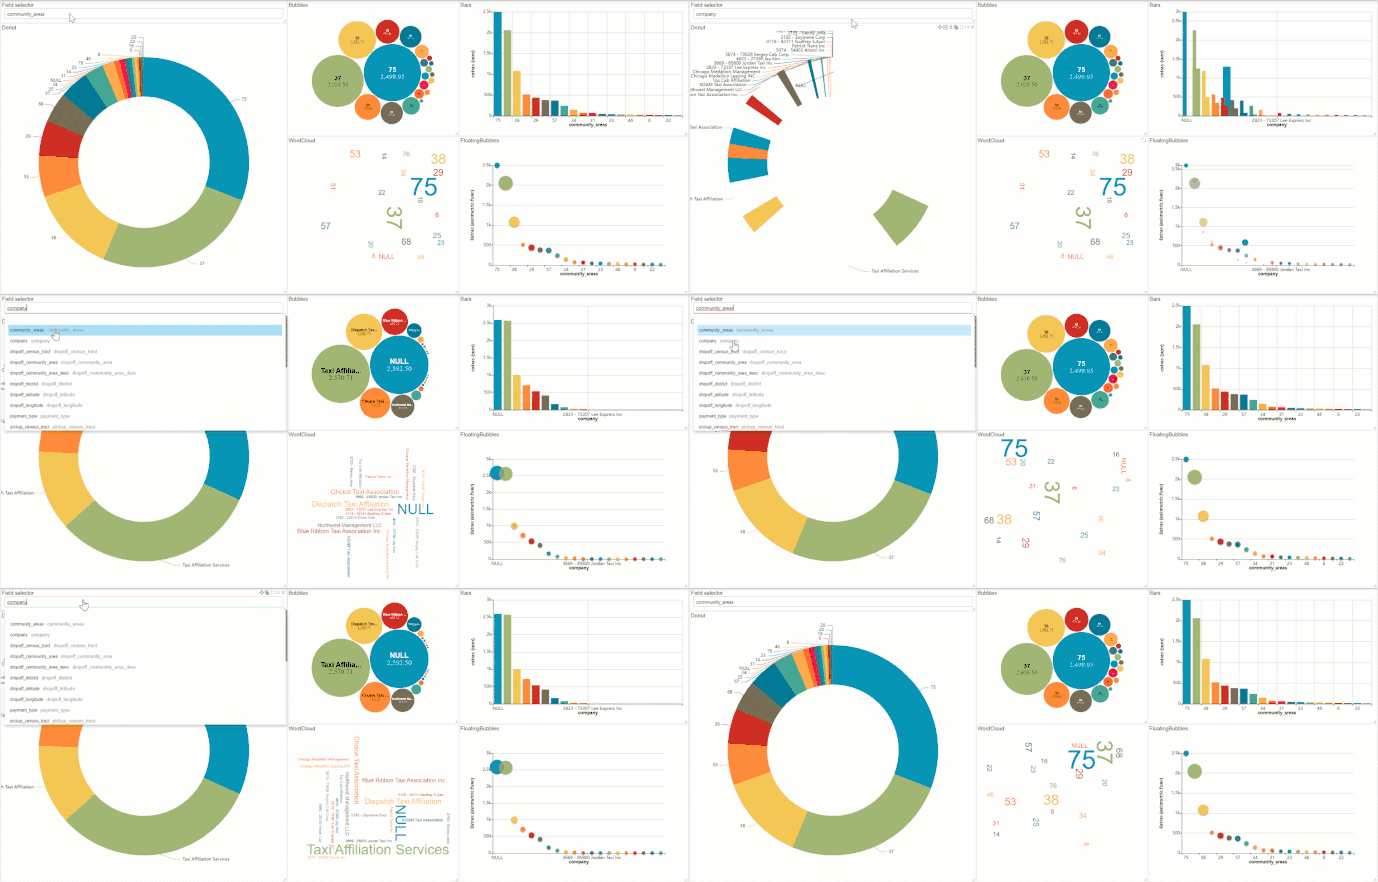
Hello, I have a dashboard with several visualizations (Bars, Bubbles, Donut, Word Cloud, Floating bubbles, etc.) that shows the behavior of electronic product sales, grouped by a specific attribute, which in this case is the product brand, for example Samsung.
Recently, the company’s management requested that the default attribute be dynamically changed in order to visualize how sales based on the new attribute behave.
I know that creating new visualizations with the new attributes changed manually can show me the sales behavior for that new attribute but it would be an inefficient solution since I would have to duplicate the visualizations to show the groups for each attribute.
I also tried doing some hacks, but couldn’t get it right.
Any suggestions on this?
Thanks.


 , it is very sure that this will help me, I will try adding the Field Selector to accomplish that.