Hi ChartFactor team, I am exploring the ChartFactor Py tool, which so far seems excellent to me, due to the level of interaction that I can reach with the visualizations.
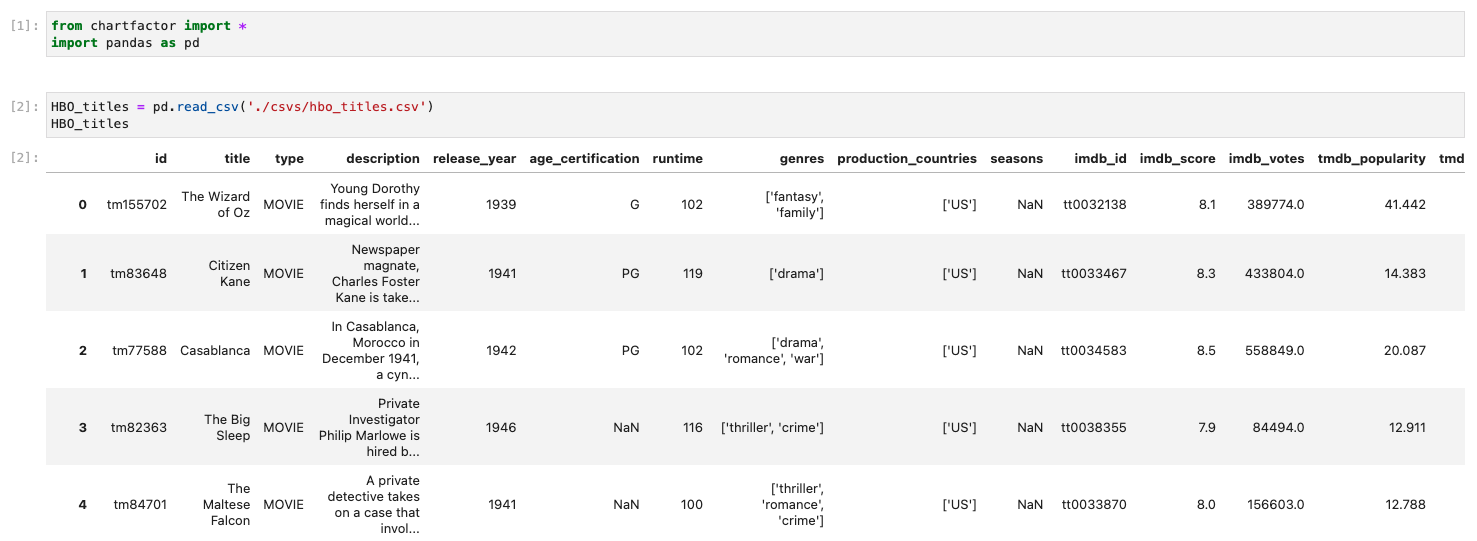
I am working on a dataset that I downloaded from Kaggle (HBO Max TV Shows and Movies), which contains information about the Titles of the HBO Max platform.
As you can see, in the image below, the genres column is represented as an array:
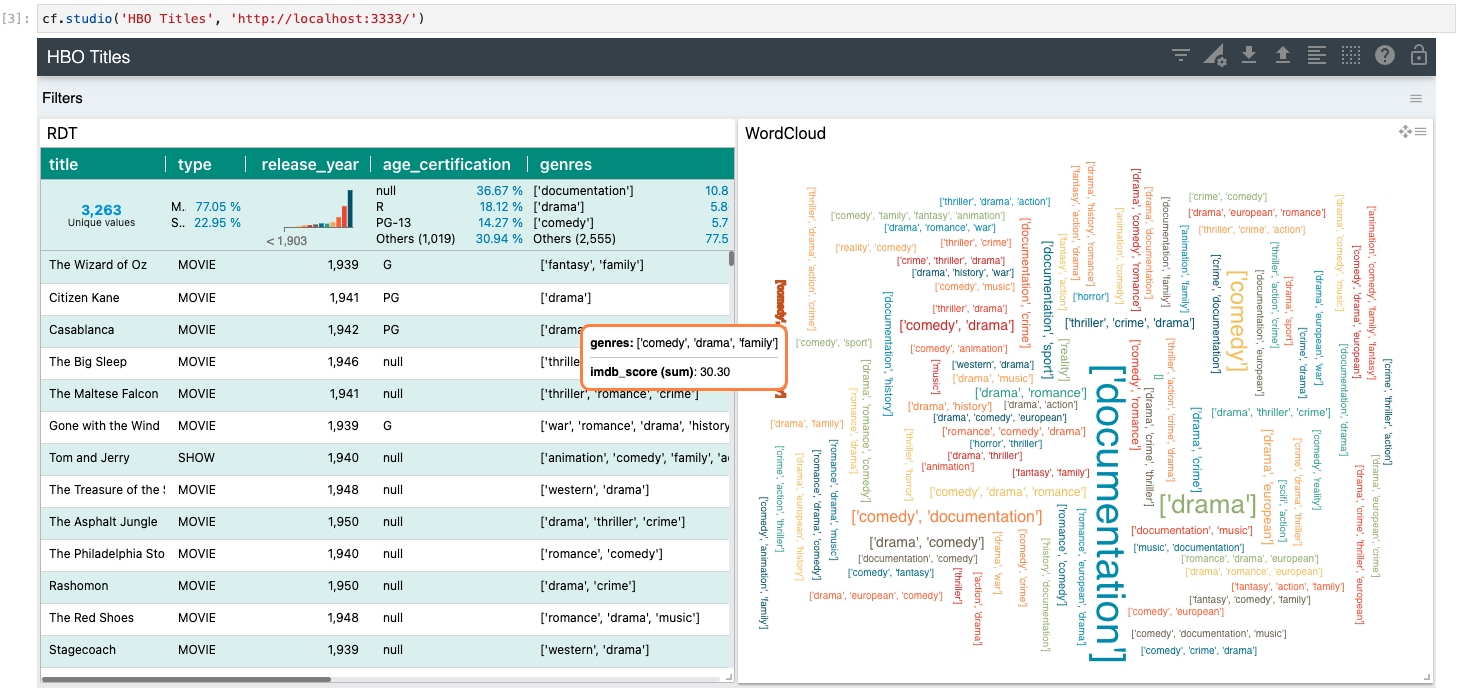
So far so good, but, when I create a dashboard and create a Word Cloud visualization, the words appear grouped, but the array is displayed as a string instead of the individual words.
How can I group the words of the genres arrays but separately to be able to see the information regarding each genre?
Hi @stevepy, thanks for reaching out. After analyzing your problem, I can tell you that what happens with that dataset is that the Genres column is not actually of type Array but rather of type String, and that is the reason why you see the groups in that way in Word Cloud visualization.
ChartFactor Py has the capability to automatically group by each element of an array or tuple, when the data type of the column is one of these two types.
So to achieve this you can try the following code to sanitize and convert the column to an array.
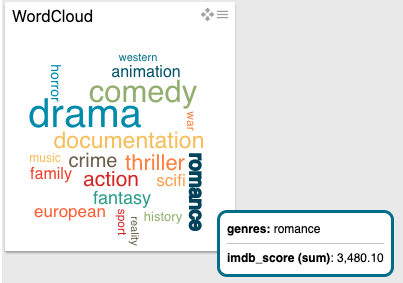
HBO_titles['genres'] = HBO_titles['genres'].str.strip('[]').str.replace("'", "").str.replace(" ", "").str.split(',')
After re-running your dashboard, the Word Cloud visualization should look similar to the image below.
Give it a try, and let me know if this meets your requirement.
Hi @juan.dominguez, that works perfectly, thanks for sharing this solution, I will keep exploring the tool and if I have any other problems I will let you know.