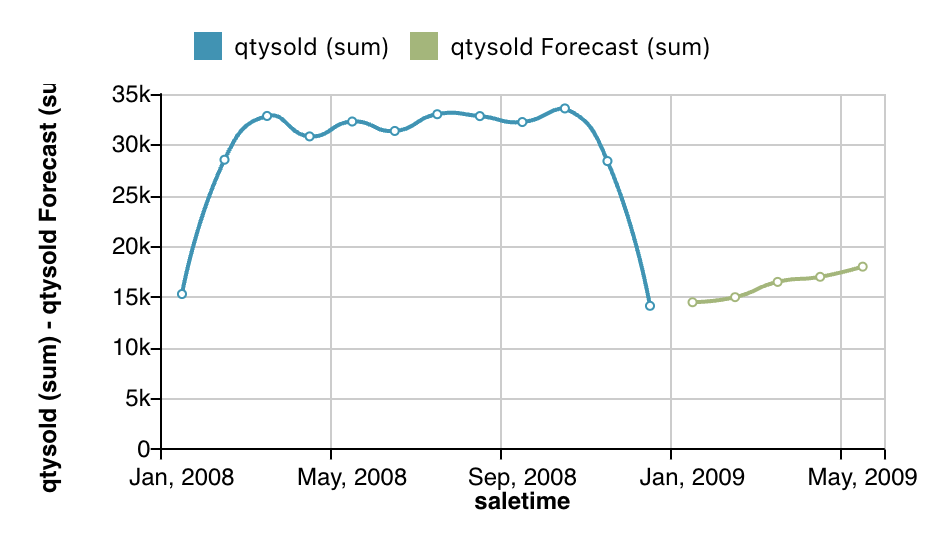
Hello, I currently have a Trend chart that shows sales over time. In addition to this historical data, I also have forecast data projecting what sales could look like over the next 10 MONTHS. Is it possible to include this forecast data in the same chart?
I see, and yes, you can achieve this by using custom data in a Multimetric Trend chart instead of the Trend chart. To do so, you’ll need to create custom queries to retrieve the data from your data source, then combine it with your forecast data. Once the data is merged, you can render both the historical and forecast values in the same chart. The metric coming from the data source will be used with its original field name, while the metric coming from the forecast data should be assigned a different name so it can be rendered as a separate line. Here’s an example:
// Example forecast data (this would normally come from your own forecast source)
const forecastData = [
    { "date": "2009-01-01 00:00:00.000", "val": 14500 },
    { "date": "2009-02-01 00:00:00.000", "val": 15000 },
    { "date": "2009-03-01 00:00:00.000", "val": 16500 },
    { "date": "2009-04-01 00:00:00.000", "val": 17000 },
    { "date": "2009-05-01 00:00:00.000", "val": 18000 }
];

async function setup() {
    // Step 1: Query the original datasource (historical sales data)
    let data = await queryData();

    // Step 2: Merge historical and forecast data into a single dataset
    let customData = buildData(data);

    // Step 3: Create a chart layout with margins if you need
    let grid = cf.Grid()
        .top(40)
        .right(56)
        .bottom(15)
        .left(65);

    // Step 4: Create and render the Multimetric Trend chart
    let myChart = cf.create()
        .graph("Multimetric Trend") // Chart type
        .data(customData)           // Supply the merged data
        .set("grid", grid)          // Apply grid layout
        .element("your_element_id") // ID of the container element in HTML
        .execute();                 // Render the chart
}

function buildData(data) {
    // Map forecast data into the same structure as datasource results
    const mappedData = {
        data: forecastData.map(cd => {
            const dataItem = {};
            dataItem.group = [cd.date]; // Group by date (same as historical data)
            dataItem.current = {
                metrics: {
                    "qtysold_forecast": { // Assign a DIFFERENT metric name for forecast
                        "sum": cd.val
                    }
                }
            };
            return dataItem;
        })
    };

    // Merge historical data with forecast data
    // NOTE: mergeData is just a placeholder function; implement according to your needs
    let newData = mergeData(data.data, mappedData.data);

    // Define chart groups (x-axis) and metrics (y-axis lines)
    const customData = {
        groups: [
            {
                name: "saletime",
                label: "saletime",
                func: "MONTH",
                type: "TIME"
            },
        ],
        metrics: [
            {
                name: "qtysold",         // Historical metric
                label: "qtysold",
                type: "NUMBER",
                hideFunction: false,
                func: "sum",
            },
            {
                name: "qtysold_forecast", // Forecast metric (different name)
                label: "qtysold Forecast",
                type: "NUMBER",
                hideFunction: false,
                func: "sum",
            },
        ],
        data: newData // The merged dataset
    };
    return customData;
}

async function queryData() {
    // Build a query to retrieve historical sales from your datasource
    return new Promise((resolve, reject) => {
        let m1 = cf.Metric("qtysold", "sum"); // Metric: total quantity sold
        let group1 = cf.Attribute("saletime")
            .func("MONTH")   // Group by month
            .limit(1000)     // Limit results
            .sort("asc", "saletime"); // Sort ascending by time

        let sFilters = []; // You can add static filters if needed

        // Execute query against your datasource (Elasticsearch in this case)
        cf.provider("Elasticsearch")
            .source("ticket_sales") // Data source
            .staticFilters(sFilters)
            .groupby(group1)
            .metrics(m1)
            // Event: when query execution stops (i.e., data is ready)
            .on("execute:stop", data => {
                try {
                    // Get existing chart instance if it exists
                    let akt = cf.getVisualization("your_element_id");
                    if (akt) {
                        // Rebuild the custom data with forecast + historical again
                        // This ensures the chart updates correctly if filters are applied
                        akt
                            .data(buildData(data)) // Rebuild merged dataset
                            .execute();            // Re-render chart
                    }
                    resolve(data); // Return the queried data
                }
                catch (e) {
                    reject(e); // Handle any errors
                }
            })
            .element("dummy") // Dummy element (query runs without rendering)
            .execute();
    });
}

// Run the setup function to start everything or implement this as you need
setup();
if you need more information about how to merege the data you can check the Custom data documentation to evaluate the structure you need for the chart
A little complex, but i’ll give it a try, thanks
Sure, let me know if you need more help.
well…, my data is in the correct position. Could you please share an example of the data merge function?
Well, you haven’t shown me how you get the data, but assuming you use ChartFactor’s custom queries, you can merge the data in this way:
const utils = cf.getDependency('utils');

const mergedData = utils.mergeData(data1, data2, data3); // you can send each data array as a separate argument
1 Like
I see it looks like this function is something new, I used, and it works fine, so thanks for the tip.