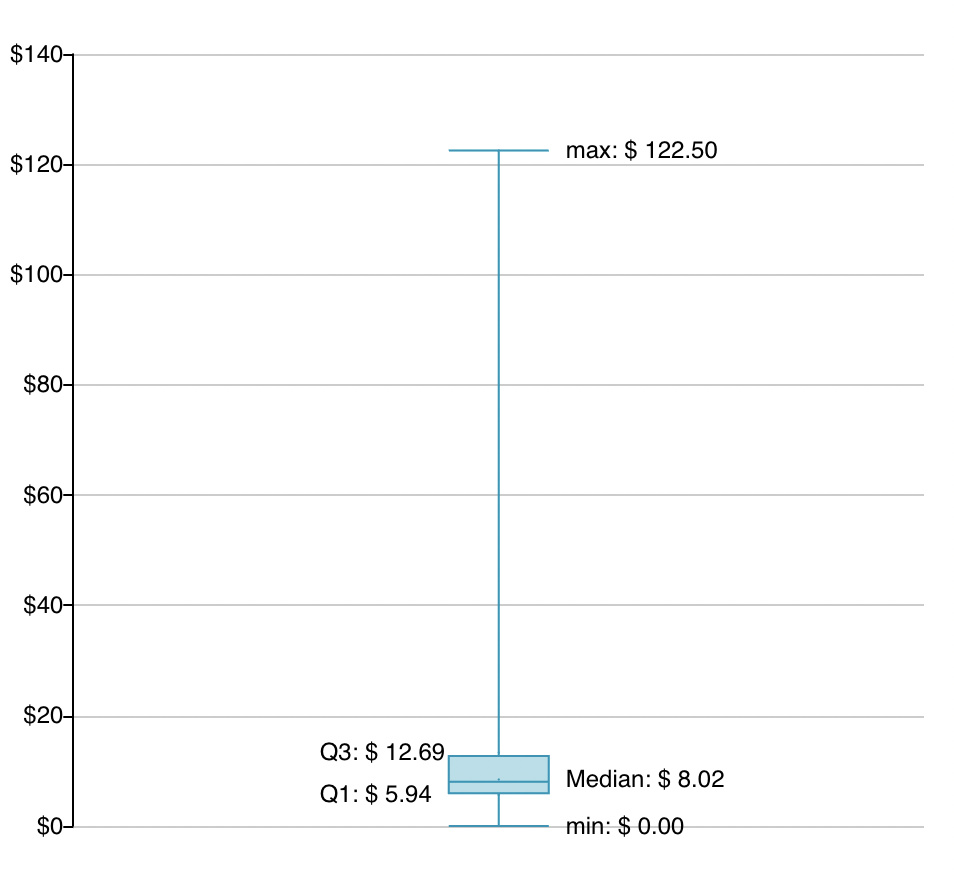
Hi! I want create a Box Plot but don’t really need to be grouped, is it possible to show only a metric?
Yes, it is. First change to Code Editor Mode and then remove .groupby() statement. In this case you will have only one Box Plot element. Also I recommend to set serieLabel option. I.E:
.set(“serieLabel”, {
show: true,
rotate: 0,
fontSize: 12,
color: “black”,
position: “alternate”,
})
For more information visit Box Plot - ChartFactor Documentation
Thank you so much! There’s another thing, theres a 0.00 value appearing on my Y axis. I think is the minimum but I need to hide it, is it possible?
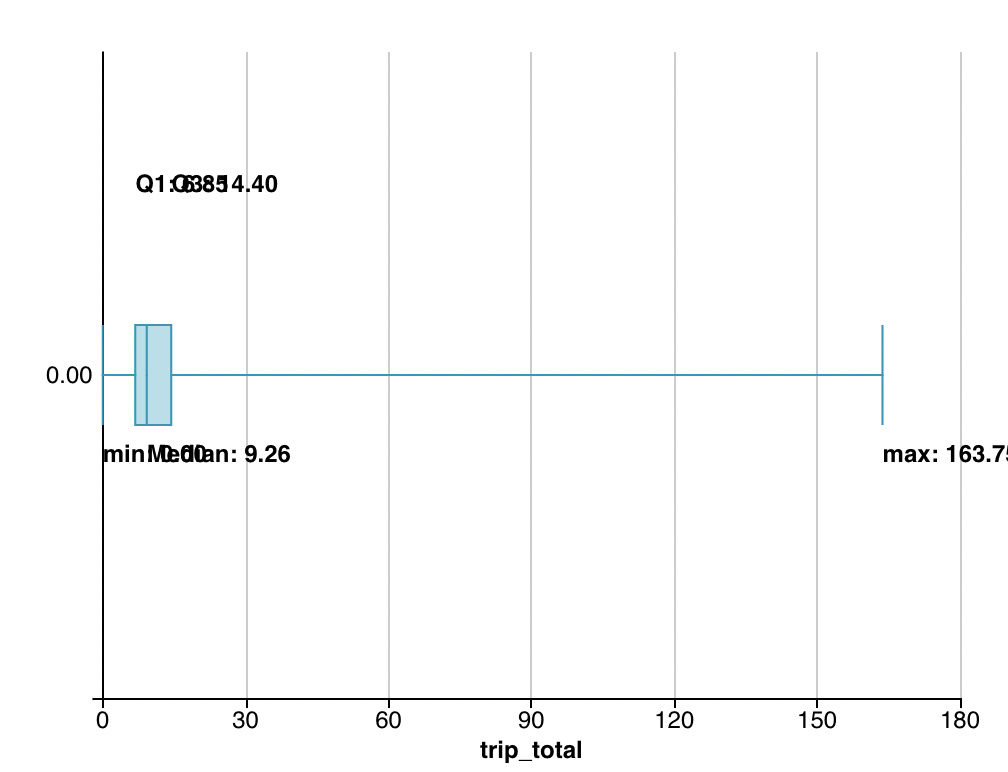
Yes, add to your code .set(“yAxis”, { “show”: false }) . Also I recommend to add a rotate: 270, inside your serieLabel to avoid labels overlapping