I have been using Studio for a while and some time ago I saw the new feature to create charts using the UI component instead of the traditional code editor. However, stacked bars or clustered bars options are not available when using the UI component. Right now my solution is to switch the UI to code mode and use the placement option: .set('placement', 'stacked') or .set('placement', 'clustered') . Is there a way to do the same using the new UI component by any chance?
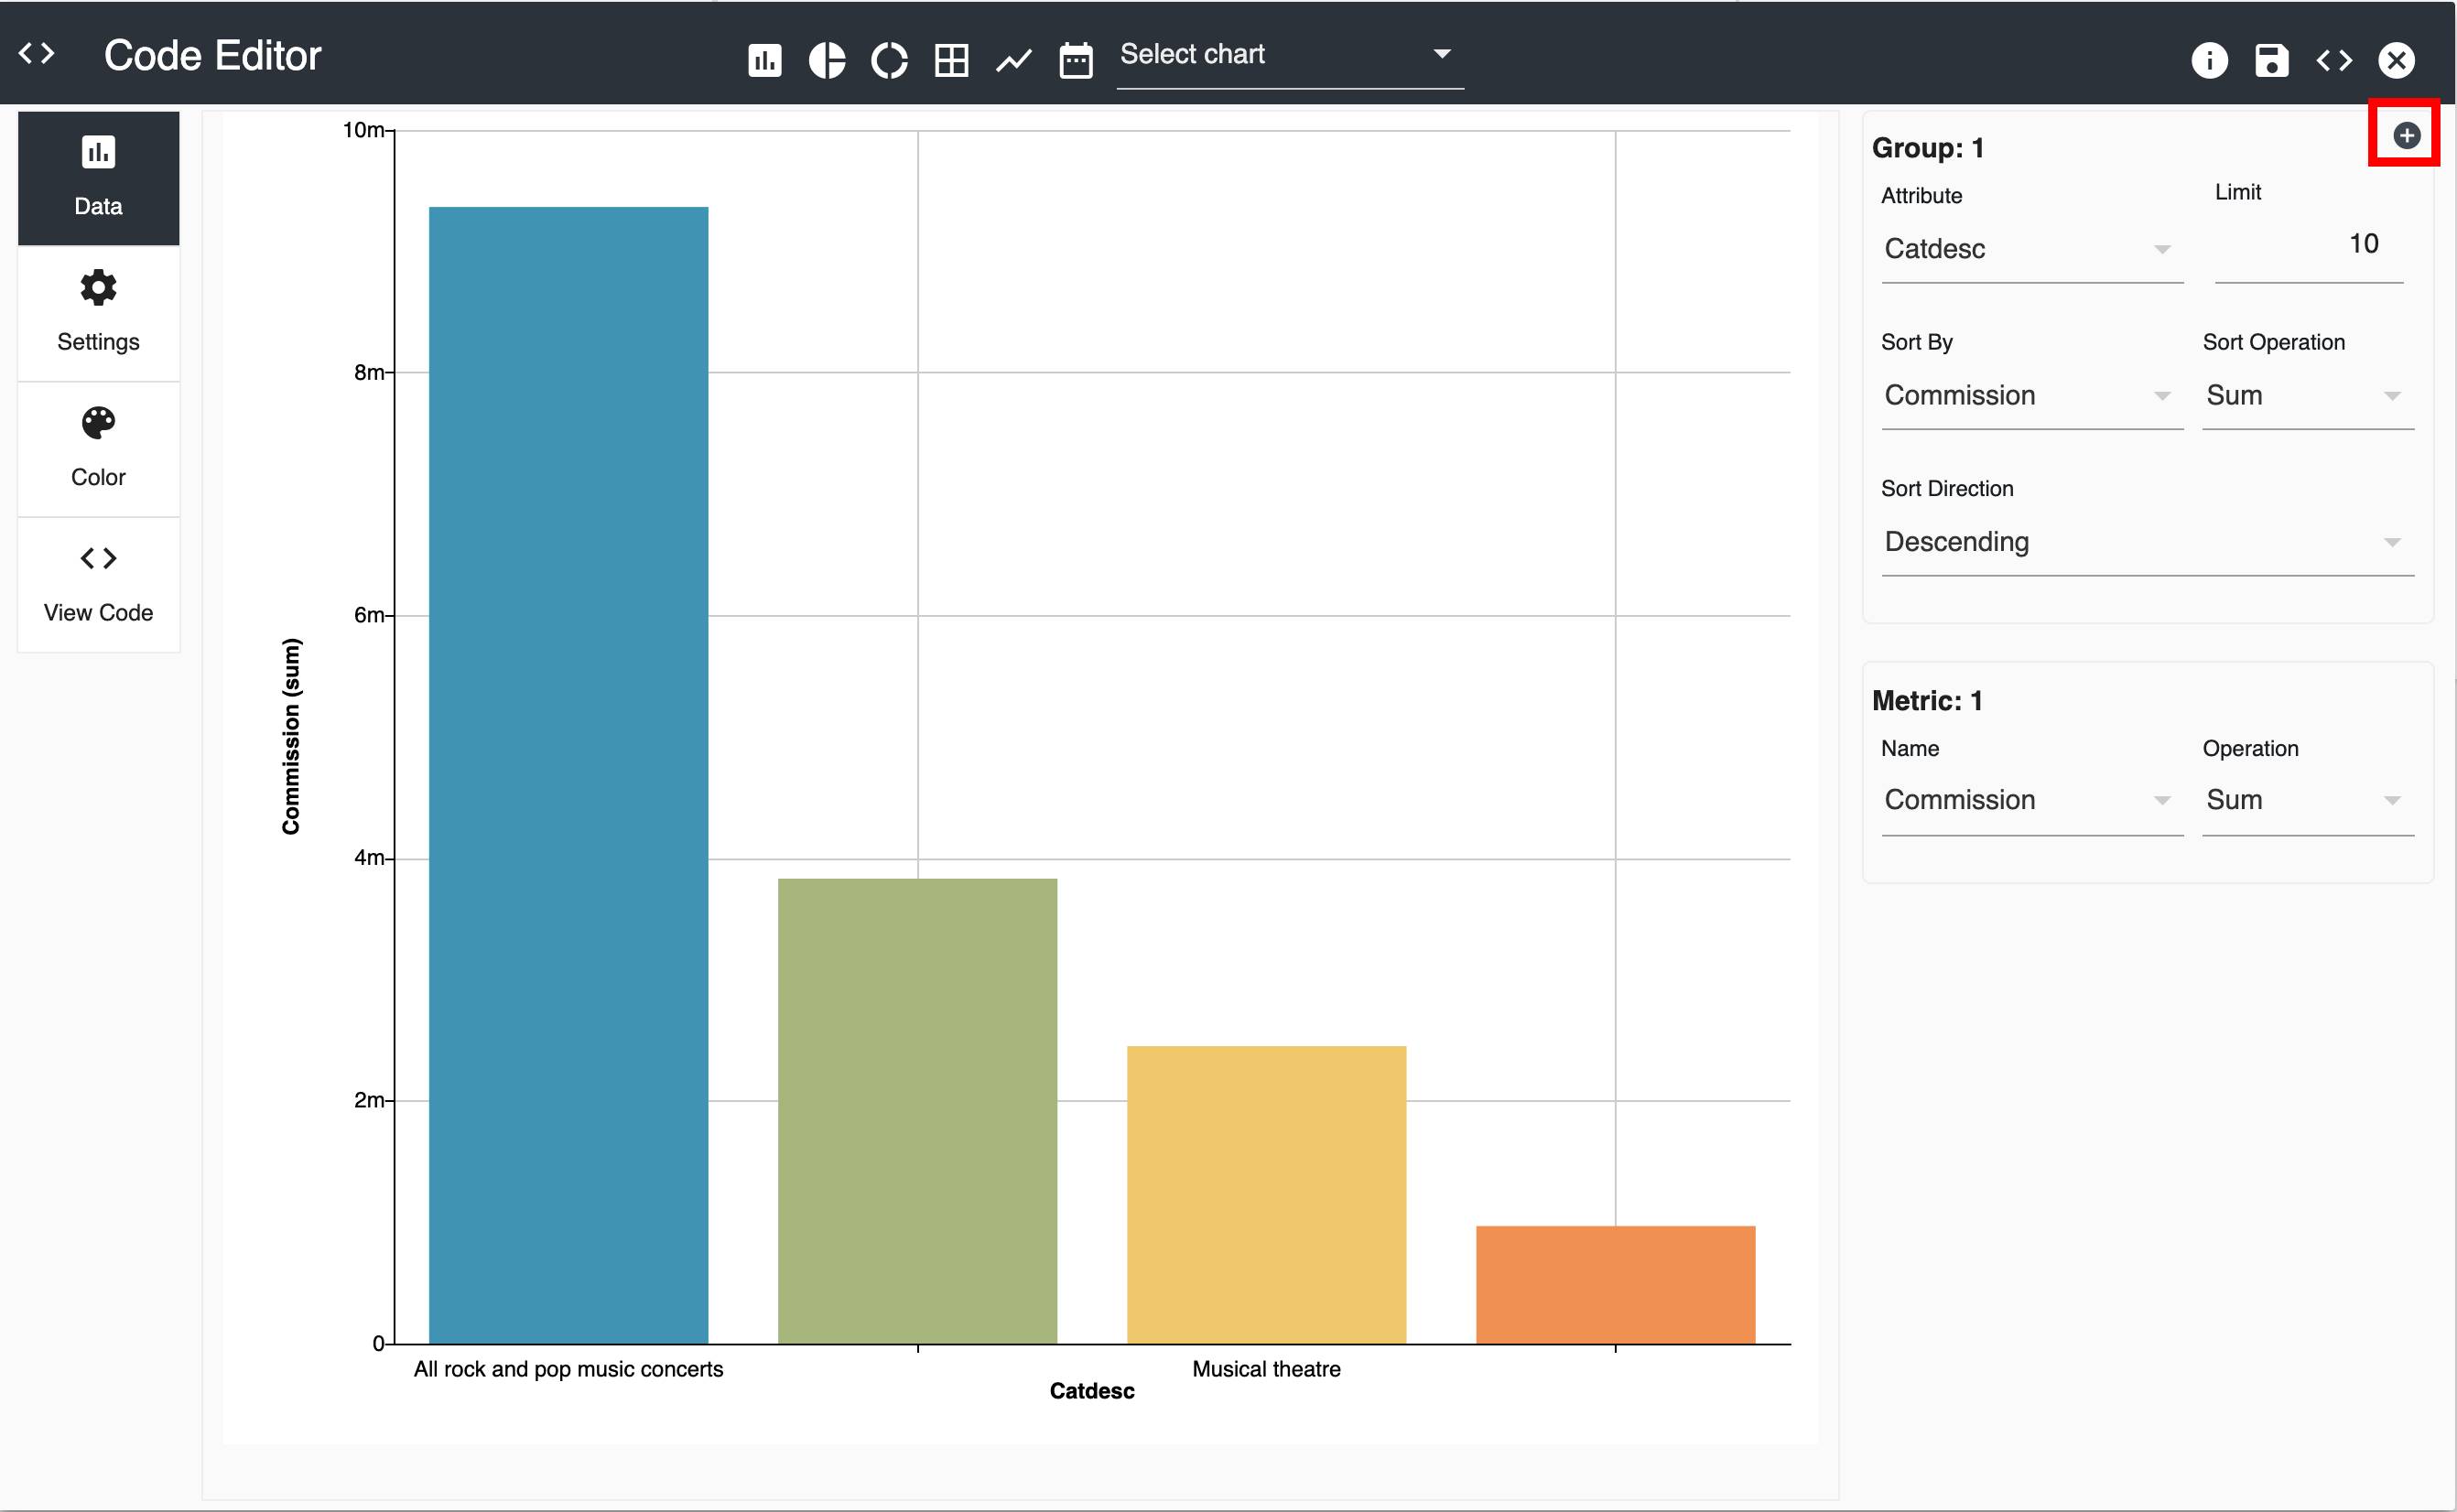
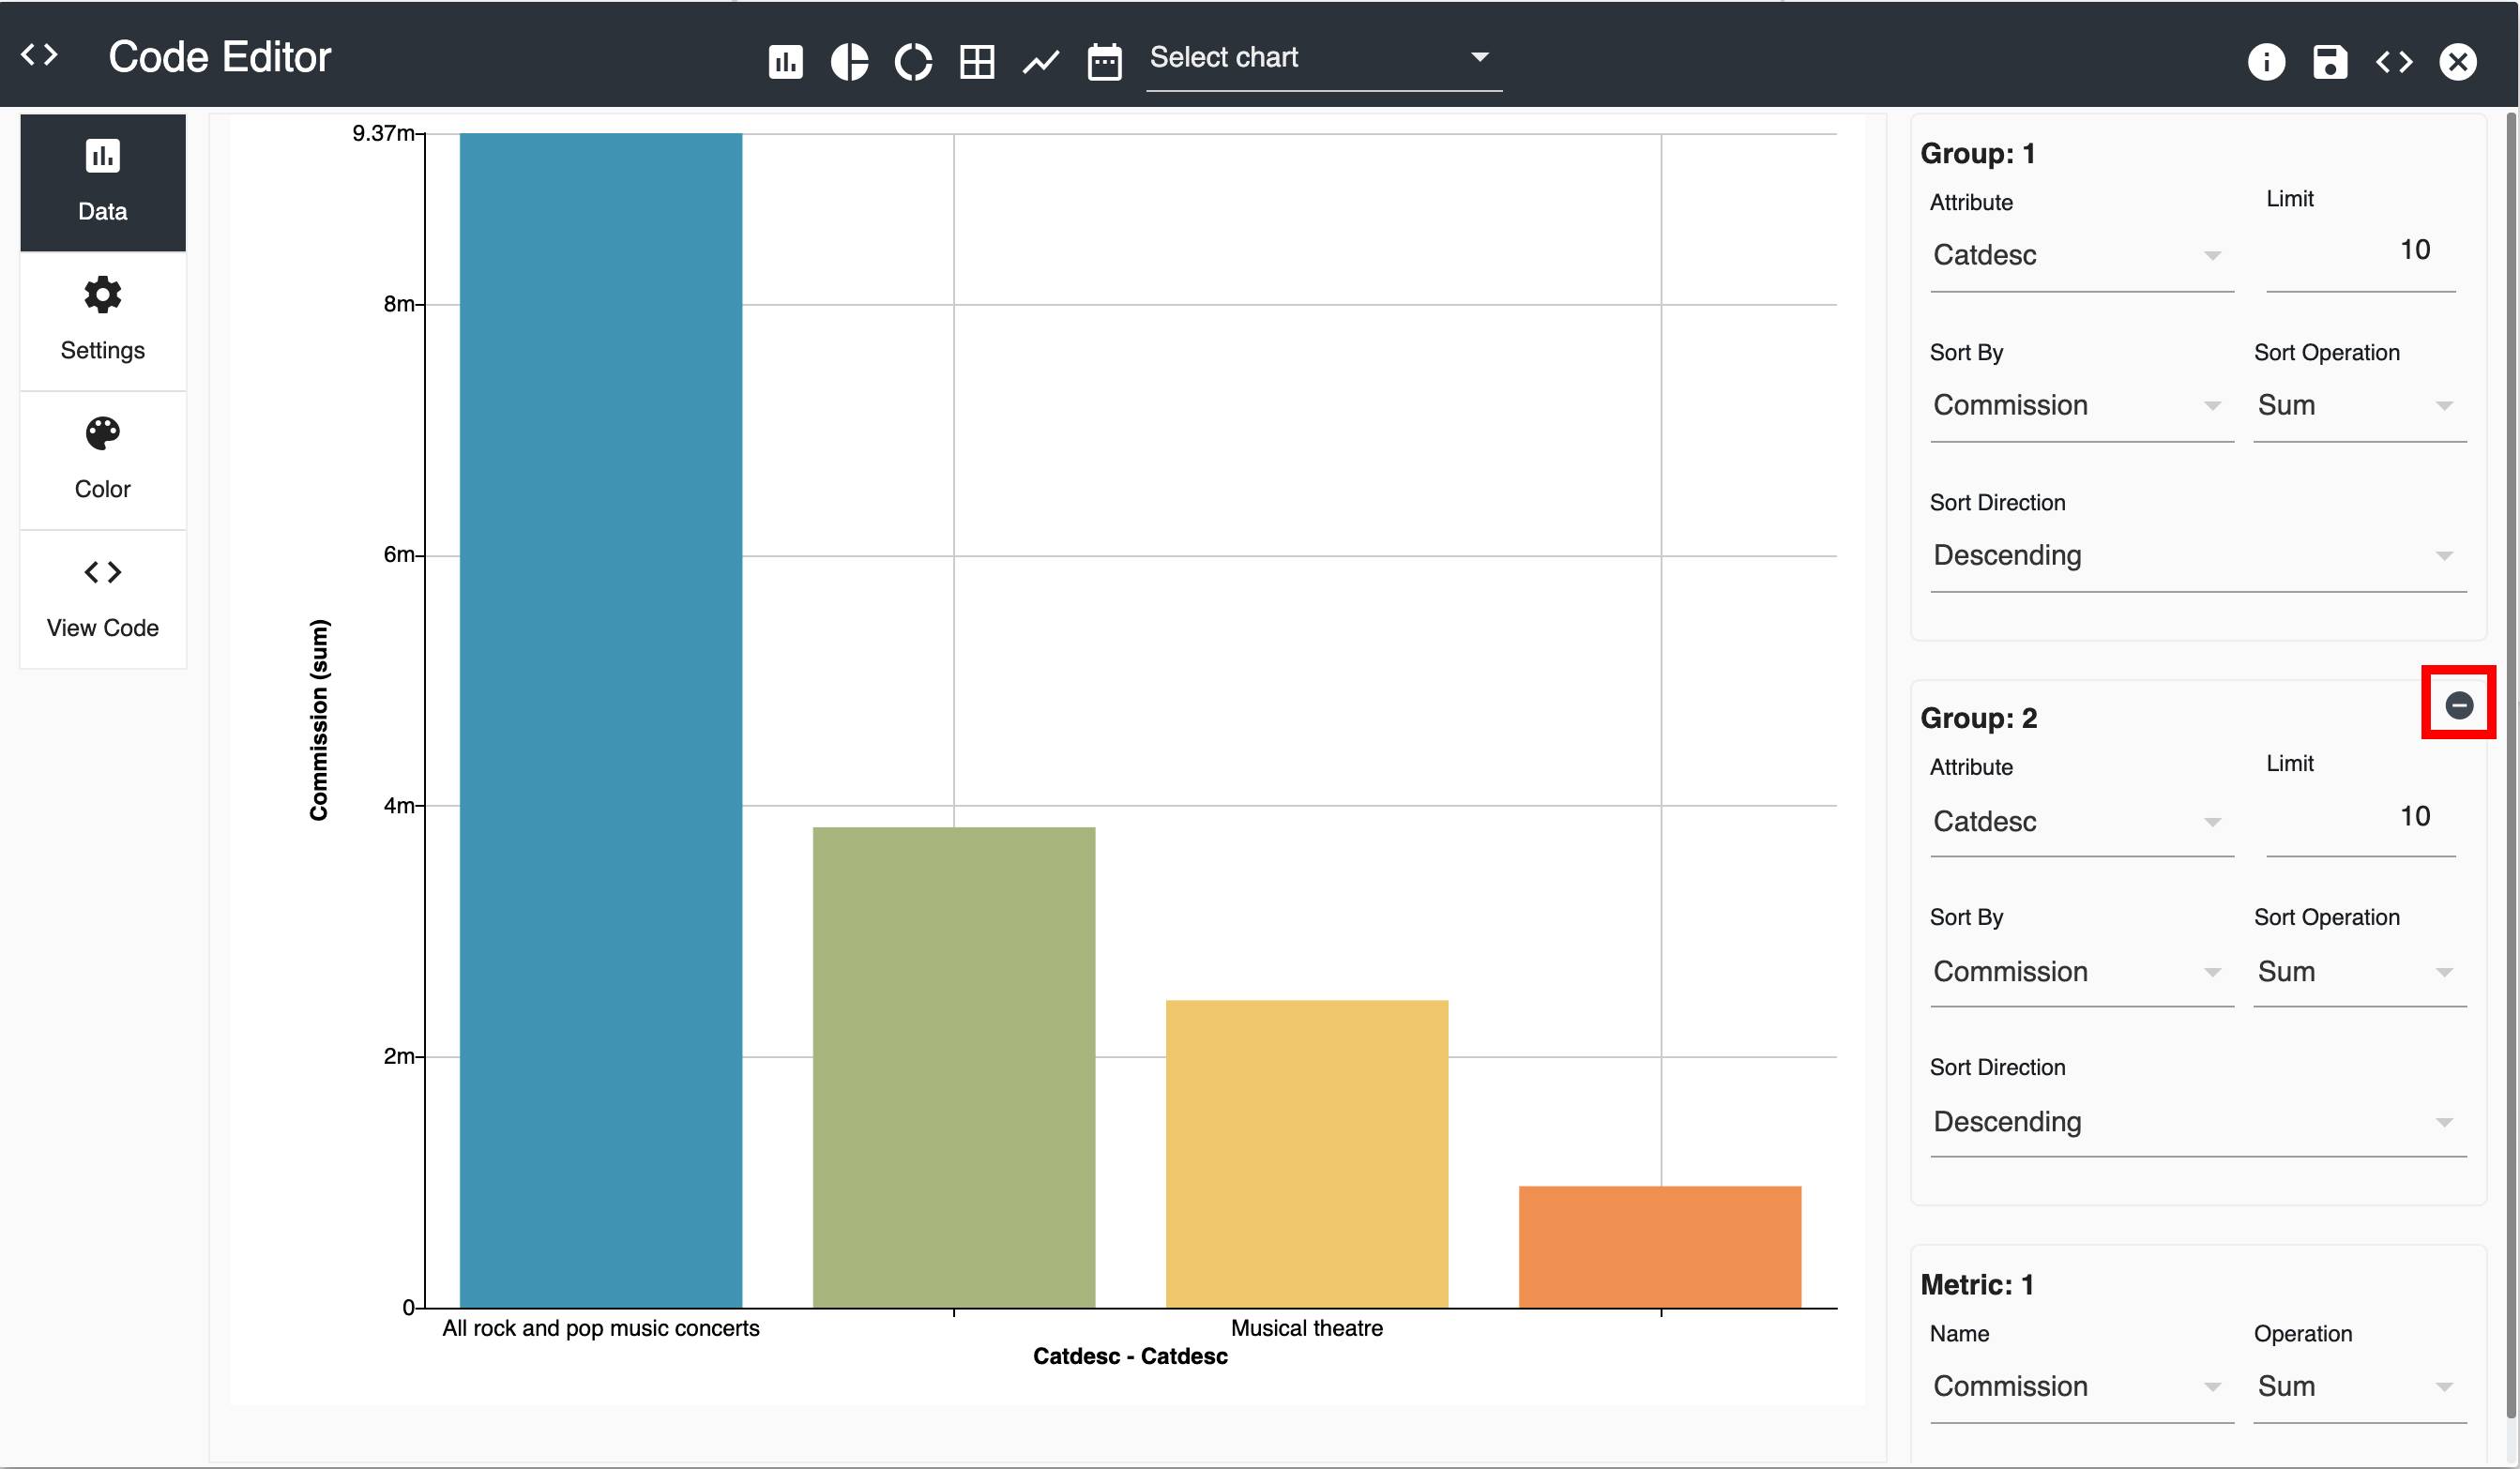
Hi, @Joseph I think your question is about the support of the UI to create a stacked bar visualization. You can do that very easily. If you are in the Data option inside UI in the top-right corner of the group container you can see a tiny icon, clicking on this button allows you to add a new group to the visualization and with that, you have a new stacked bar visualization created. If you need to go again to a bars chart you can delete the newly created group. In that way, you can change between Bars and Stacked Bars charts just clicking on a button.
Nice, I saw the icon in the group container and it works for me. I have another question. What happens if I want to change between stacked and clustered bars, but without switching the UI to code mode?
Hi, @Joseph. after you added a new group, you can go to the Settings option to change between stacked and clustered bars. There you’ll see a new Placement menu, right after the Orientation. Inside this menu, you can play changing the visualization between Stacked and Clustered. In any case, I share a picture of the interface.
