The drill-in settings for a Geo Map shape layer


#1

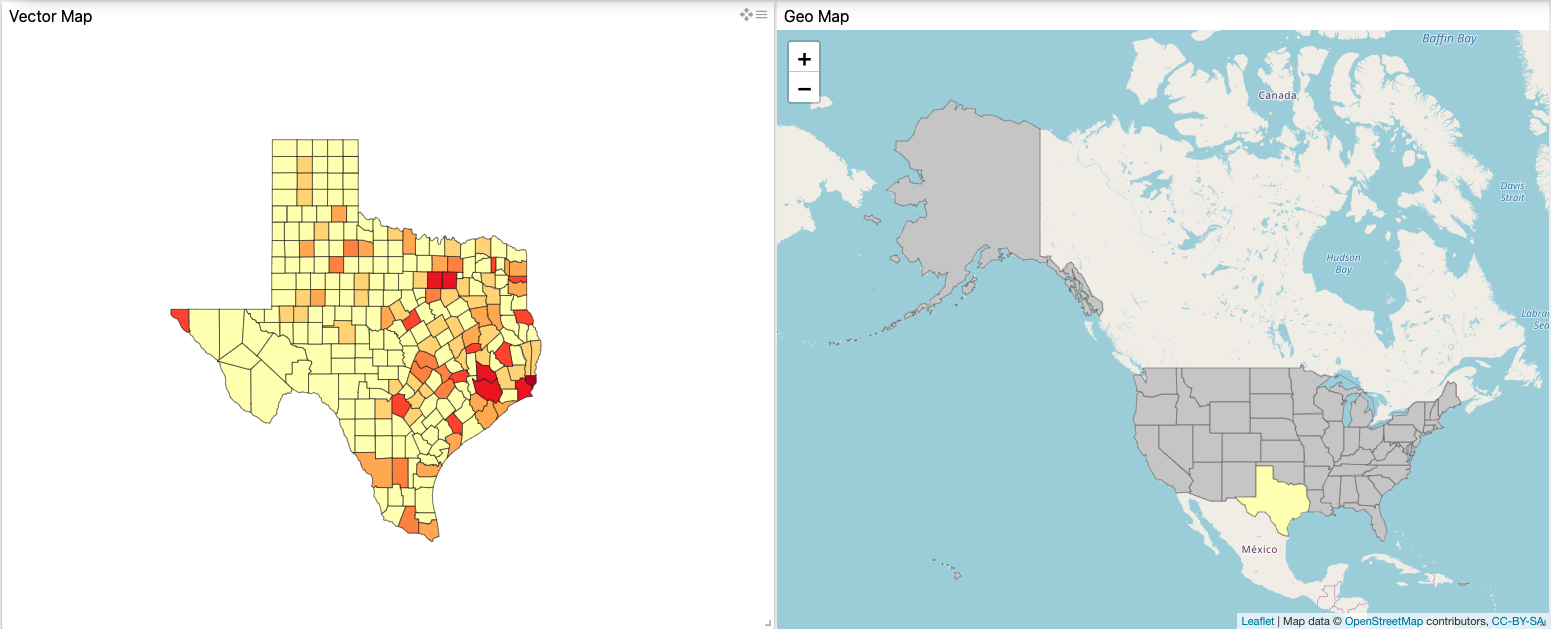
Hi guys, I’m exploring the drill-in feature in the Geo Map. For this I am basing myself on the documentation on how to configure drill hierarchies for shape-based visualizations. To perform the test, I have two visualizations, a Vector Map and a Geo Map as you can see in the following image:

Both visualizations have the same settings for the drill-in hierarchy in the Interaction Manager, except for the states shape in the Geo Map, because I’m using the chartfactor US states:

let viz1 = getId("Vector Map");
let viz2 = getId("Geo Map");
let drill = {
    [viz1]: {
        group1: [{
                field: "state",
                default: {
                    shape: "usa",
                    zoom: 0.9350000000000024,
                    center: [-94.57113927217495, 37.48584466749503]
                }
            }, {
                field: "county",
                default: {
                    shape: "https://localhost:8000/texas-counties.geo.json",
                },
                prevFilterValue: {
                    "Texas": {
                        shape: "https://localhost:8000/texas-counties.geo.json",
                        zoom: 0.4798028405457119,
                        center: [-98.94915330750659, 31.464693072612278]
                    }
                }
            }]
    },
    [viz2]: {
          group1: [{
                    field: "state",
                    default: {
                        shape: "https://chartfactor.com/resources/us-states.json",
                        zoom: 3,
                        center: [53.23537469292837, -119.38737824201608]
                    }
                }, {
                    field: "county",
                    default: {
                        shape: "https://localhost:8000/texas-counties.geo.json",
                    },
                    prevFilterValue: {
                        "Texas": {
                            shape: "https://localhost:8000/texas-counties.geo.json"
                        }
                    }
                }]
    }
};

The problem is that after clicking on a US State, none of the two visualizations change to counties shape and I’m getting the following exception in the console:

Uncaught (in promise) Error: Geo Map drill config: Only rows or columns are allowed as properties

If I remove or comment out the Geo Map drill-in setting in the Interaction Manager, then the Vector Map does load the counties as designed, but the Geo Map keeps the States shape.

I think I am missing some configuration in the Geo Map, since the error is telling me, but what does it mean that only rows or columns are allowed as properties for the Geo Map? Why is working for the Vector Map?


#2

Hi @karla.cryan, thanks for contacting us and for the detailed explanation of what you are trying to do. Indeed, in the documentation of the hierarchy drill-in configuration for shape-based visualizations on which you are basing, it is correct, but it only works for the Vector Map because it is a visualization that performs an aggregate query, that’s why is defined with group1, group2, …, groupn.

Now, keep in mind that the Geo Map is a visualization that performs a pivot type query, and as specified in the Special drill hierarchy configuration section, for the Geo Map you must specify the rows property and then put the row number as a sub-property inside the rows object.

So to make it work for you on the Geo Map, you need to replace the Map’s drill-in setting with this:

[viz2]: {
        rows: {
            1: [{
                field: "state",
                default: {
                    shape: "https://chartfactor.com/resources/us-states.json",
                    zoom: 3,
                    center: [53.23537469292837, -119.38737824201608]
                }
            }, {
                field: "county",
                default: {
                    shape: "https://localhost:8000/texas-counties.geo.json",
                },
                prevFilterValue: {
                    "Texas": {
                        shape: "https://localhost:8000/texas-counties.geo.json"
                    }
                }
            }]
        }
    }

Try making that change, I’m sure it will work for you. If you have any other questions, don’t hesitate to ask us.