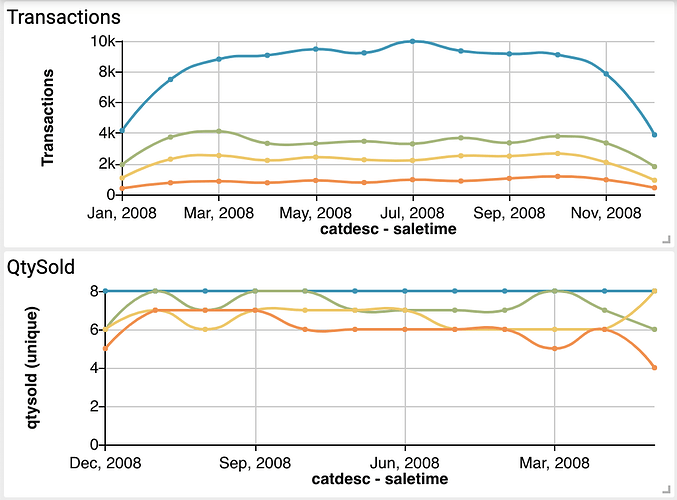
Hi guys. I recently created two Trend charts using Studio and I’d like their x-axis to match when placed one below the other with the same widget size. I selected the same attributes for both groups and different metrics for each widget. However, one of them starts at a different time when compared with the other. How can I make them start at the same date?
Hi @Olivia_Jones, I see the problem in your picture but it is hard to diagnose with this limited information. Are you sure both trend charts have the same attribute configuration? Maybe you can share the trend’s groups and metrics configuration.
Hi @arturo , sure here is the code for the first Trend.
// Define metrics

let metric0 = cf.Metric(“count”);

// Define attributes to group by

let group1 = cf.Attribute(“catdesc.keyword”)

.limit(10)

.sort(“desc”, metric0);

let group2 = cf.Attribute(“saletime”)

.func(“MONTH”)

.limit(1000)

.sort(“desc”, “saletime”);

// Add metrics and groups to data source

let myData = source.groupby(group1,group2)

.metrics(metric0);

// Define chart options

// Define Grid

let grid = cf.Grid()

.top(10)

.right(15)

.bottom(20)

.left(65);

// Define Color Palette

let color = cf.Color()

.palette(["#0095b7", “#a0b774”, “#f4c658”,

“#fe8b3e”, “#cf2f23”, “#756c56”,

“#007896”, “#47a694”, “#f9a94b”,

“#ff6b30”, “#e94d29”, “#005b76”]);

let myChart = myData.graph(“Trend”)

.set(“grid”, grid)

.set(“color”, color)

.set(“dataZoom”, false)

.execute();
and here the code about the second one:
// Define metrics

let metric0 = cf.Metric(“qtysold”, “unique”);

// Define attributes to group by

let group1 = cf.Attribute(“catdesc.keyword”)

.limit(10)

.sort(“desc”, metric0);

let group2 = cf.Attribute(“saletime”)

.func(“MONTH”)

.limit(1000)

.sort(asc, “saletime”);

// Add metrics and groups to data source

let myData = source.groupby(group1,group2)

.metrics(metric0);

// Define chart options

// Define Grid

let grid = cf.Grid()

.top(10)

.right(15)

.bottom(20)

.left(65);

// Define Color Palette

let color = cf.Color()

.palette(["#0095b7", “#a0b774”, “#f4c658”,

“#fe8b3e”, “#cf2f23”, “#756c56”,

“#007896”, “#47a694”, “#f9a94b”,

“#ff6b30”, “#e94d29”, “#005b76”]);

let myChart = myData.graph(“Trend”)

.set(“grid”, grid)

.set(“color”, color)

.set(“dataZoom”, false)

.execute();
In this particular case, the widgets don’t match because the groups are configured differently. For the x-axis to match, you need to make sure both charts have the same configuration in terms of attributes, limit, sort, and sort direction. In this case the sort direction is different, that is the problem. In summary, to have both trend charts start with the same date/time, just have both of them with the exact same configuration on the attributes side. Metrics can be different.
I had a similar problem using trends. I also fixed the groups and it works perfectly. The one thing I would love to have though is a common legend for all the trends rather than individual legends for each, since they are all the same. Can I do that?
Hi @Adam, absolutely, just add the Group Legend widget to your dashboard and configure it with the same group attribute that you are using in your trend charts. Here is the document to learn more about group legends: Group Legend
Thanks! I added the Group Legend and it looks great. Is it possible to highlight the bars or lines of the affected charts as I hover on the different items on the legend?
Hi @Adam, yes you can. You need to configure the charts option in your Group Legend widget. There you can list all the widgets you would like to highlight when you hover on an item in the Group Legend. Example:
.set("charts", [ getId('Trend1'), getId('Trend2'), getId('Trend3'), ... ])
Please note the supported charts. Here is the list: Supported Charts
I gave it a try and it looks great. Thanks!
