Hi, I am prototyping a data application with studio and I need to render custom shapes on a map. How do I load geojson in Studio so that these shapes render on the map? Thank you.
hi @ryan
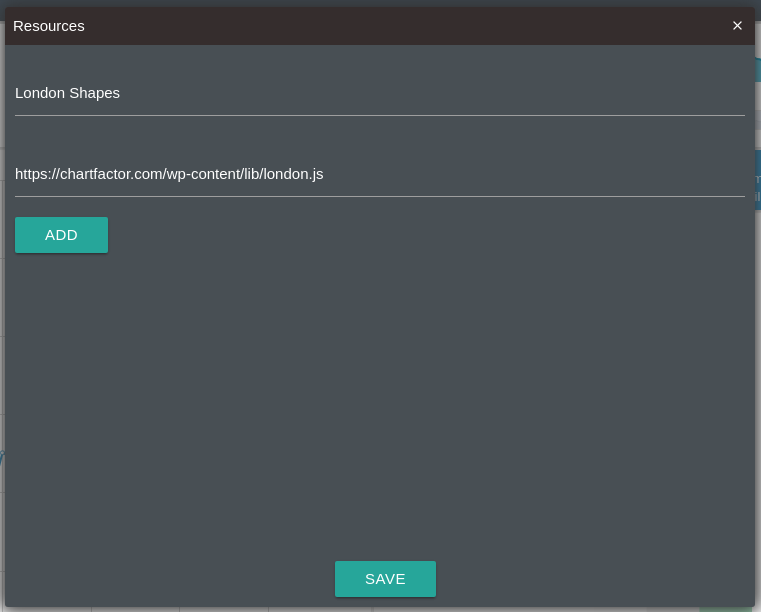
See our London Fire Brigade Calls sample data application. To import this data app, go to the Home page, click on the “New” button and then click on the “Import Sample Application” ![]() bottom on the Studio header. Once the London Fire Brigade Calls example is loaded, click on the “Load Resource”
bottom on the Studio header. Once the London Fire Brigade Calls example is loaded, click on the “Load Resource” ![]() button on the Studio header. There you will see how to define resorces. These resources are loaded before the execution of a data app so that you can use them on your widgets.
button on the Studio header. There you will see how to define resorces. These resources are loaded before the execution of a data app so that you can use them on your widgets.
Let me know if this answer your question. Best regards.
I want to use the Vector Map to show statistics of different areas of my city, but I can not find a geojson of these areas. Is there an easy and free tool to create my own custom geojsons?
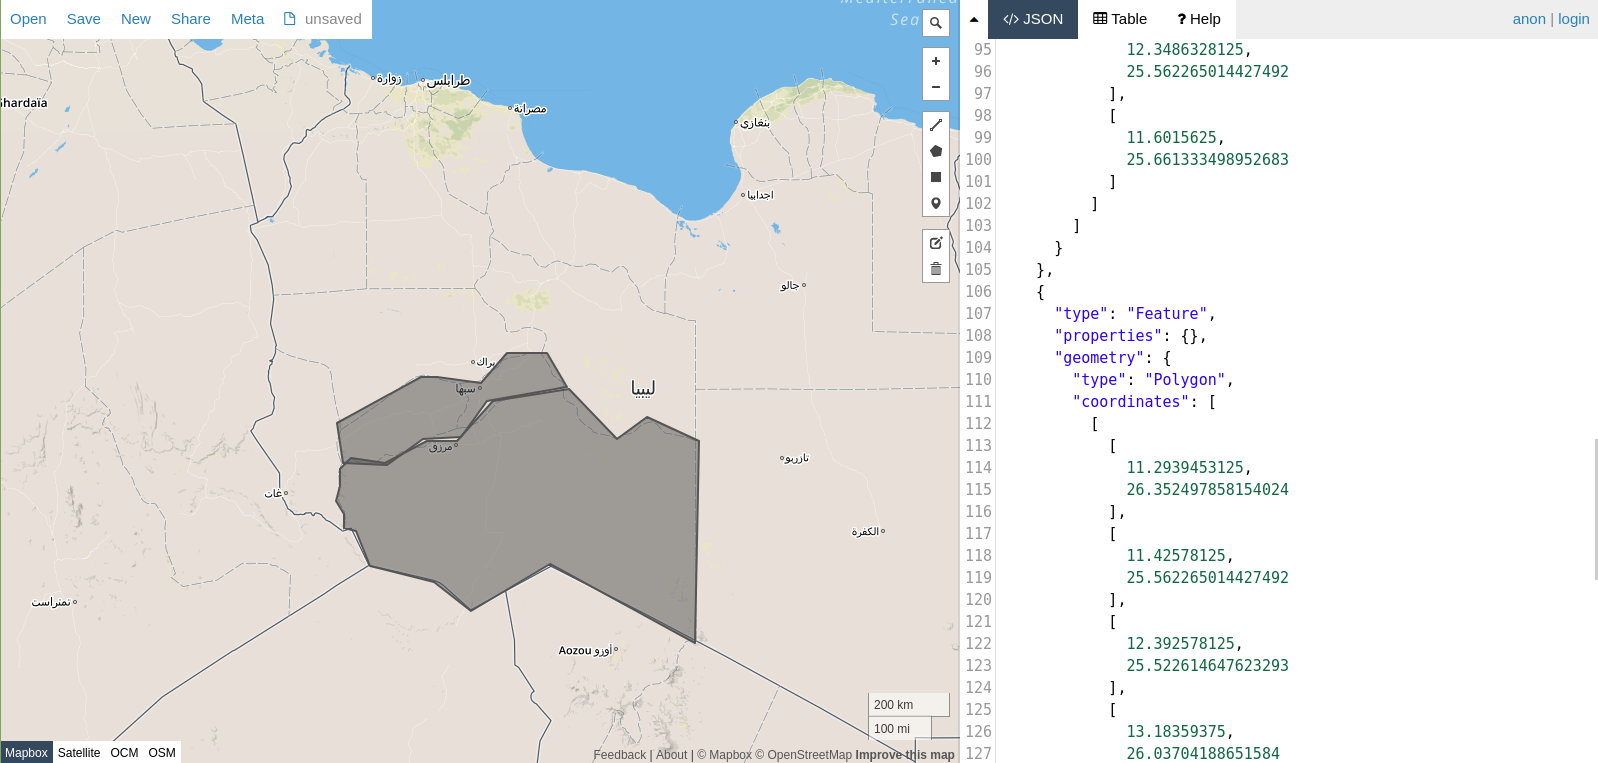
hi @john, sure there are several free and open source tools to create GeoJSON, from very profesionals and complex like QGIS to simple online tools like http://geojson.io. The one thing you need to remember is to assign a property called “name” on every shape so that values can be assigned to shapes. For example using the tool Draw Polygon of geojson.io you can do something like this::
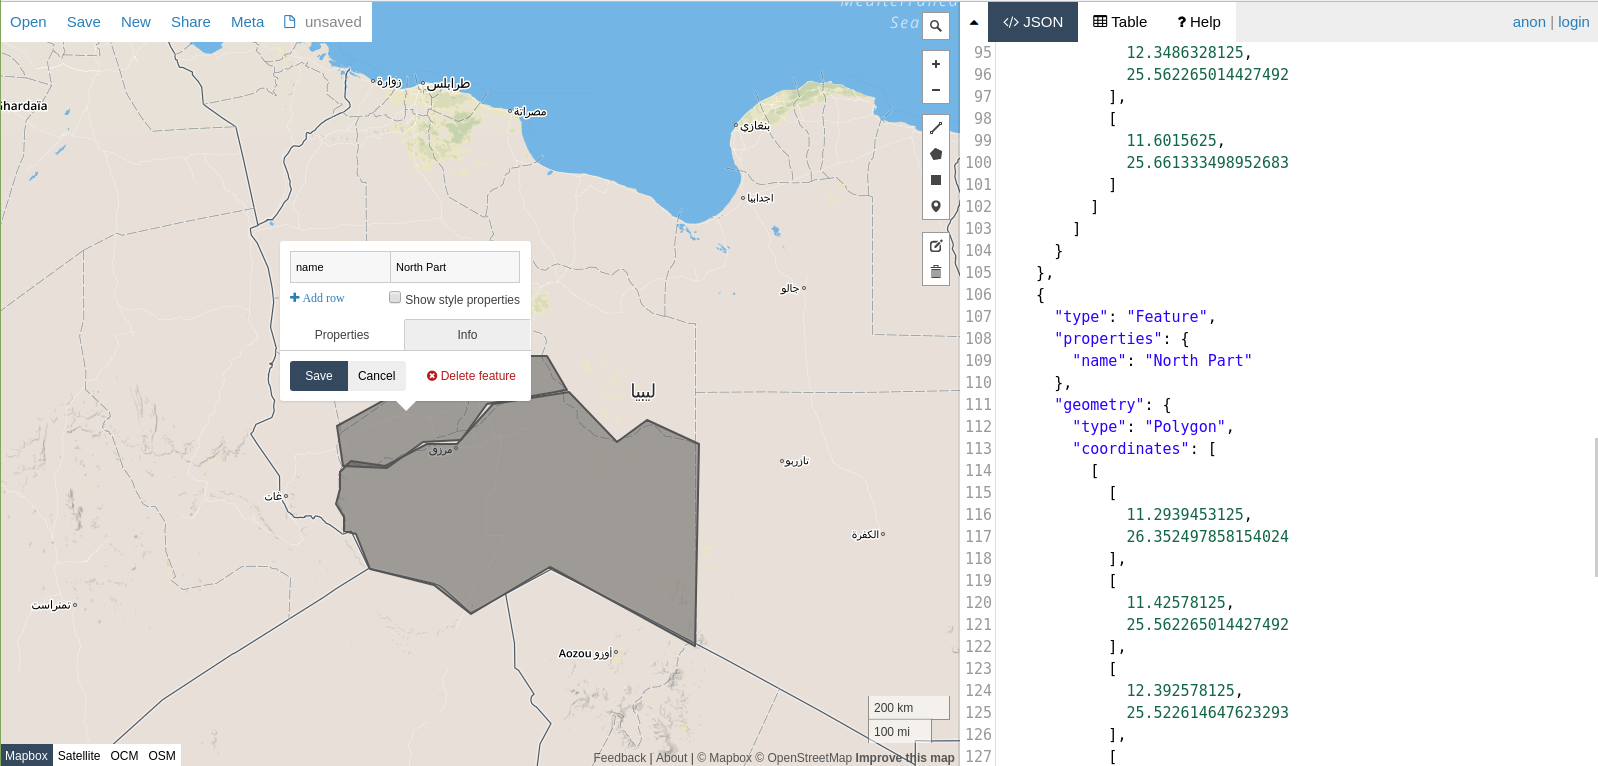
Then you can click on each polygon and assign a name:
Then you can save the GeoJson and use it in your Vector Map, you will obtain something like this:
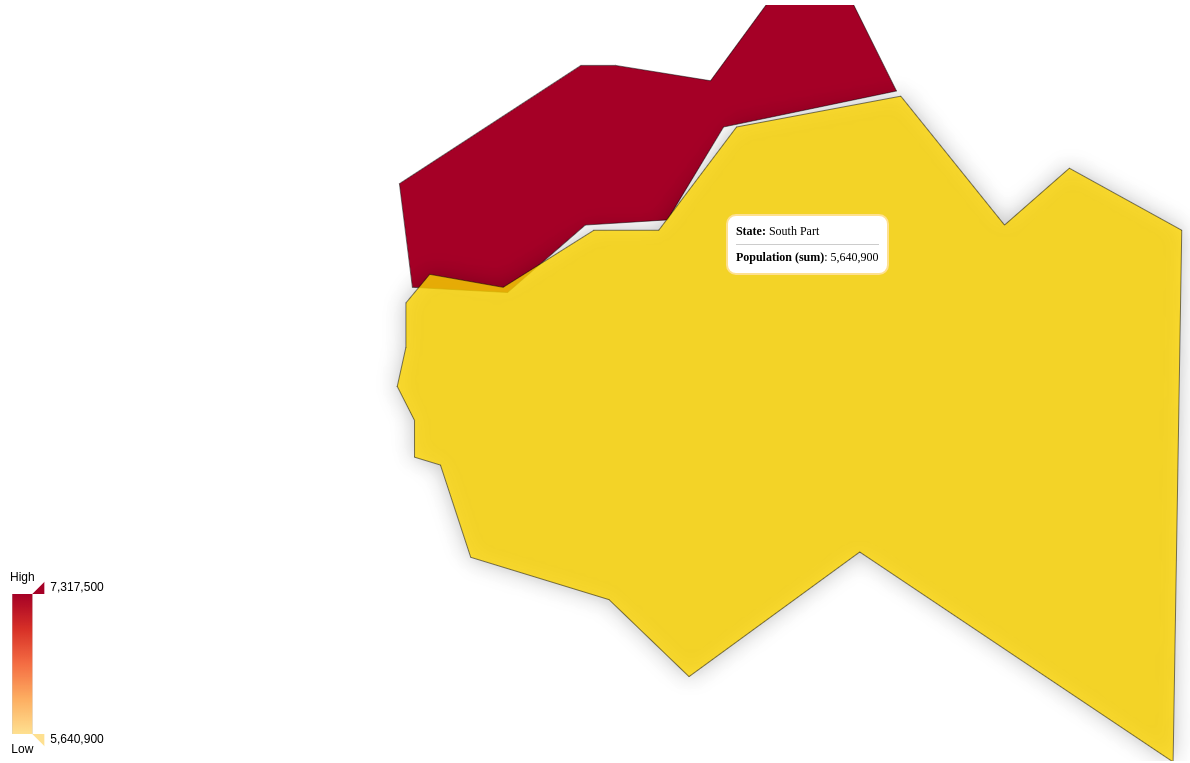
This is the code of the example:
<!DOCTYPE html>
<html>

<head lang="en">
  <meta charset="UTF-8">
  <title>Custom Vector Map</title>
</head>

<style>
html, body, .chart-ct {
    height: 100%;
}
</style>

<body>
  <div id="chart" class="chart-ct"></div>

  <script src="../../lib/cftoolkit.min.js"></script>
  <script src="../assets/cft-standard-charts.min.js"></script>
  <script>
    var customShape={type:"FeatureCollection",features:[{type:"Feature",properties:{stroke:"#555555","stroke-width":2,"stroke-opacity":1,fill:"#555555","fill-opacity":.5,name:"South Part"},geometry:{type:"Polygon",coordinates:[[[11.6015625,25.661333498952683],[11.35986328125,25.443274612305746],[11.35986328125,25.105497373014686],[11.271972656249998,24.806681353851964],[11.44775390625,24.54712317973075],[11.44775390625,24.26699728841817],[11.71142578125,24.206889622398023],[12.01904296875,23.50355189742412],[13.42529296875,23.180763583129444],[14.23828125,22.59372606392931],[15.97412109375,23.543845136505844],[19.16015625,21.94304553343818],[19.248046875,25.997549919572112],[18.10546875,26.470573022375085],[17.4462890625,26.03704188651584],[16.3916015625,27.01998400798257],[14.7216796875,26.78484736105119],[13.9306640625,25.997549919572112],[13.271484375,25.997549919572112],[12.3486328125,25.562265014427492],[11.6015625,25.661333498952683]]]}},{type:"Feature",properties:{name:"North Part"},geometry:{type:"Polygon",coordinates:[[[11.2939453125,26.352497858154024],[11.42578125,25.562265014427492],[12.392578125,25.522614647623293],[13.18359375,26.03704188651584],[14.0185546875,26.07652055985697],[14.589843749999998,26.78484736105119],[16.34765625,27.059125784374068],[15.908203125,27.72243591897343],[15.029296875,27.72243591897343],[14.4580078125,27.137368359795584],[13.4912109375,27.254629577800063],[13.1396484375,27.254629577800063],[11.2939453125,26.352497858154024]]]}}]};

    var fd = [
        {
            'group': ['North Part'],
            'current': {
                'metrics': {
                    'Population': 7317500
                }
            }
        },
        {
            'group': ['South Part'],
            'current': {
                'metrics': {
                    'Population': 5640900
                }
            }
        }
    ];

    var data = {
        groups: ['State'],
        metrics: ['Population'],
        data: fd
    };
    var metric = cf.Metric('Population');

    cf.create()
      .data(data)
      .set('shape', customShape)
      .set('colorMetric', metric)
      .set('legend', 'left')
      .set('zoom', 0.5)
      .set('enableZoom', true)
      .graph('Vector Map')
      .element('chart')
      .execute();
  </script>
</body>

</html>
I hope this answer your question. Best regards.
1 Like