ChartFactor 1.12 Released 🎊


#1

The June 2019 release of ChartFactor is now available!

ChartFactor, the leading solution to bring visual analytics to your data products, just got better and more useful to its growing customer base.

This release introduces ChartFactor Studio’s self-service UI for its most popular visualizations. Users can now configure charts with an intuitive user interface as with other BI tools. The main difference is its code transparency. To users, this means they can see the generated code as they configure and interact with their visualizations. And it is backwards compatible with existing Studio apps. Please note that not all functionality is currently available on the new self-service UI. Users, however, can switch to code editing mode to use the full power of ChartFactor Toolkit or if they prefer the “classic” view.

On the ChartFactor Toolkit’s side, its new Custom Chart enables users to bring their custom visualizations as micro-services. They become part of a system of visualizations that enables end-users to interact with them, add filters, drill-ins, and have them react to those interactions in any custom way needed.

And ChartFactor Toolkit’s new timezone support makes time-based data easier to understand by converting it to different time zones. A user in New York viewing data created in London can easily filter and interpret their queries without manually subtracting five hours. Users also have full flexibility to define date and time formats for their date/time fields. For numeric types, users can define number separators, decimal point, decimal places, and anything else to render them exactly as they desire. And full flexibility is also provided when rendering money information, including currency symbols and the position to render them.

On the visualizations side, Heat Map and Tree Map now include label auto-coloring depending on luminosity of the cells’ background color, between other improvements. The KPI visualization allows more fine-grained color configurations and the Time Slider includes color syntax improvements.

And finally, we are introducing the Studio CLI tool. It generates native html/js/css applications in seconds from Studio cfs files so that users don’t have to copy/paste Studio code into their apps. It creates individual and multi-tab applications with cross-source and cross-tab filtering. Its multi-tab support is great for applications with a large number of visualizations across multiple sources. End-users can apply filters in one tab to see them immediately reflected in all tabs.

You can follow this link: https://chartfactor.com/studio to start using ChartFactor Studio to create your data applications. And you can download the Community Version of ChartFactor Toolkit, access its documentation and release notes at https://chartfactor.com.

#2

Hi @jorge, congrats for the new release, I can see there are very interesting additions, the timezone support and the self-service UI for ChartFactor Studio are awesome, I already tested them. Now I want to test the new Studio CLI tool but I can’t get information about it on the download section or in the 1.12 documentation. This tool will have a community version? Thanks.


#3

Hi @pepe, I am glad you are already testing our latest release. Regarding the new CLI tool, it is part of our enterprise offering. Here is the user documentation: https://chartfactor.com/doc/1.12/studio-cli/. We’ll be publishing articles/videos in the coming weeks to showcase its capabilities. If you would like a demo, please send us a request using the form at the end of this page: https://www.aktiun.com/chartfactor.


#4

Hi community, I’m reviewing the new ChartFactor Toolkit functionality and I’d like to better understand the new Custom Charts. What I can do with them? What libraries can I use to create my custom visualizations? Can I re-use existing visualizations I already have? Thanks in advance.


#5

Hi @bob, the ChartFactor Custom Chart is a lightweight visualization that allows you to embed a custom legacy web application or a new one made with your choice of web technologies into a ChartFactor toolkit application environment, for enterprise users (those who have access to the interactive visualization package). It provides an easy and secure mechanism to exchange information with the ChartFactor Interaction Manager component, making it easy to send and receive filters. To enable that feature, you have to add some code to your web application. You can take a look at the Custom Chart documentation page and test this integration on the official ChartFactor Studio Site. Let me know if you have any questions. Best Regards.

Note that ChartFactor Studio is served as a secure site (https) so it is advisable to serve your Custom Chart from a secure source.


#6

Hi @dario, if we can use Custom Charts only with secure sites, how can I test my development env with the public Studio server, thanks !!!


#7

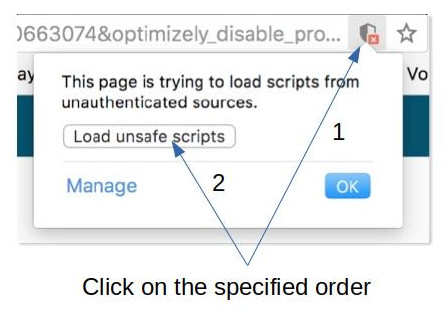
Hi @ryan, you have two options to run your Custom Chart into the public Chartfactor Studio site, the easiest one is to enable the option “Load unsafe script”, in the way that shows the picture below:
untrusted%20sources
And the second is to use a self-signed certificate registered on the Trusted Root Certification Authorities store, you can take a look at this article that explains this option very well: https://reactpaths.com/how-to-get-https-working-in-localhost-development-environment-f17de34af046. I hope this answer your question. Let me know if you have any problem. Best regards.


Creating a Custom Filter Descriptor to Studio